
** Sustainable Worldwide Transportation ended its operation in March 2018. **
|
|
Sustainable
Worldwide
|
|
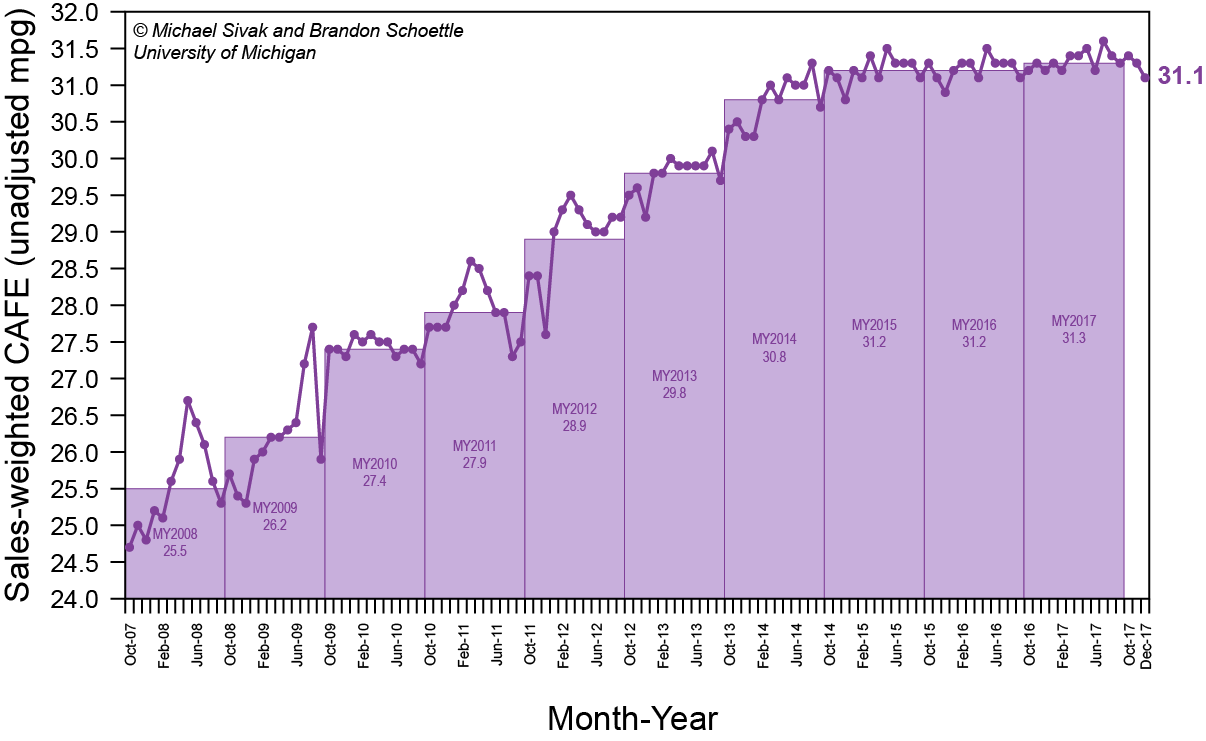
Sales-weighted unadjusted CAFE
performance The sales-weighted unadjusted Corporate Average Fuel Economy (CAFE) performance was calculated from the monthly sales of individual models of light-duty vehicles and the unadjusted combined city/highway fuel-economy ratings for the respective models. (Datafiles containing summaries of test-level data for individual models, including unadjusted fuel-economy ratings, are available for download from the EPA for each model year.) For both monthly and model year averages, sales-weighted harmonic means were calculated. The bars in the graph show the average for each model year. Vehicles purchased from October 2007 through September 2008 were assumed to be model year 2008. Analogous assumptions were made for vehicles purchased in each following model year. The unadjusted fuel-economy information was available for 99.5% of vehicles purchased. These unadjusted fuel-economy ratings are not directly comparable to the "window sticker" ratings published in the EPA Fuel Economy Guide. These raw values are adjusted by the EPA to derive the estimated on-road fuel-economy ratings that are published in the EPA guide and on window stickers. For cases in which the EPA datafile contained multiple unadjusted fuel-economy ratings for a vehicle model, the average of these ratings was used (without regard to sales figures for each specific engine or vehicle-model variant). Additionally, when a vehicle model was sold during a particular model year but it is not listed in that year’s EPA data file, the fuel-economy rating(s) from the most recently available year were used. Finally, for very low sales-volume manufacturers (e.g., Ferrari, Rolls-Royce, etc.), all vehicle models for that manufacturer were aggregated and one average unadjusted fuel-economy rating was calculated. Analogously, the sales figures for such manufacturers and models were also aggregated each month. (Data for recent months are occasionally updated in the underlying EPA data source, possibly resulting in small changes to recent fuel economy values.) Note: These calculations do not take into account the various credits and adjustments available to manufacturers when determining final CAFE performance values. Consequently, these values cannot be used for assessing compliance with CAFE standards because the results may underestimate the final CAFE values. Latest data: December 2017. Last updated: January 4, 2018.
|
(click on the graph to view full size)
| Year | Month | |||||||||||
| Jan | Feb | Mar | Apr | May | Jun | Jul | Aug | Sep | Oct | Nov | Dec | |
| 2007 | 24.7 | 25.0 | 24.8 | |||||||||
| 2008 | 25.2 | 25.1 | 25.6 | 25.9 | 26.7 | 26.4 | 26.1 | 25.6 | 25.3 | 25.7 | 25.4 | 25.3 |
| 2009 | 25.9 | 26.0 | 26.2 | 26.2 | 26.3 | 26.4 | 27.2 | 27.7 | 25.9 | 27.4 | 27.4 | 27.3 |
| 2010 | 27.6 | 27.5 | 27.6 | 27.5 | 27.5 | 27.3 | 27.4 | 27.4 | 27.2 | 27.7 | 27.7 | 27.7 |
| 2011 | 28.0 | 28.2 | 28.6 | 28.5 | 28.2 | 27.9 | 27.9 | 27.3 | 27.5 | 28.4 | 28.4 | 27.6 |
| 2012 | 29.0 | 29.3 | 29.5 | 29.3 | 29.1 | 29.0 | 29.0 | 29.2 | 29.2 | 29.5 | 29.6 | 29.2 |
| 2013 | 29.8 | 29.8 | 30.0 | 29.9 | 29.9 | 29.9 | 29.9 | 30.1 | 29.7 | 30.4 | 30.5 | 30.3 |
| 2014 | 30.3 | 30.8 | 31.0 | 30.8 | 31.1 | 31.0 | 31.0 | 31.3 | 30.7 | 31.2 | 31.1 | 30.8 |
| 2015 | 31.2 | 31.1 | 31.4 | 31.1 | 31.5 | 31.3 | 31.3 | 31.3 | 31.1 | 31.3 | 31.1 | 30.9 |
| 2016 | 31.2 | 31.3 | 31.3 | 31.1 | 31.5 | 31.3 | 31.3 | 31.3 | 31.1 | 31.2 | 31.3 | 31.2 |
| 2017 | 31.3 | 31.2 | 31.4 | 31.4 | 31.5 | 31.2 | 31.6 | 31.4 | 31.3 | 31.4 | 31.3 | 31.1 |
Publications | Fuel economy and emissions monitoring | Contact us
Page updated: Tuesday, April 3, 2018
Copyright © 2006-2018 The Regents of the University of Michigan, Ann Arbor, MI 48109 USA