University of Michigan laser optical pumping/MRI set-up. A mixture of natural Xenon and Nitrogen gas flows into the optical pumping cell where the Xenon is polarized with a time constant of 10 minutes. The polarized gas either flows or is transferred in single doses to the subject in the MRI magnet bore. A fiber optic bundle provides Laser Diode Array light for optical pumping.
Graduate Student Matt Rosen built it and makes it work.
Laser polarized ^129Xe has been used as a magnetic tracer of blood flow and for in vivo NMR imaging in rat brain. ^129Xe polarization, four orders of magnitude greater than in thermal equilibrium, was produced by a laser-optical pumping apparatus adjacent to a 2.0 Tesla MRI unit. Xenon gas was transported from the optical pumping apparatus to the intubated animal's lungs in single breath doses over about 40 seconds. The time dependences of the ^129Xe magnetization in blood and tissue and its accumulation in the brain were studied. We conclude that by increasing the volume and absolute polarization of the ^129Xe, it will be possible to apply this technique to human brain activation studies based on quantitative measurement of regional cerebral blood flow.
(1) Department of Radiology, University of Michigan, Ann Arbor, Michigan 48109
(2) Department of Physics, University of Michigan, Ann Arbor, Michigan 48109
(3) Neurosciences Laboratory, University of Michigan, Ann Arbor, Michigan 48109
* Corresponding author
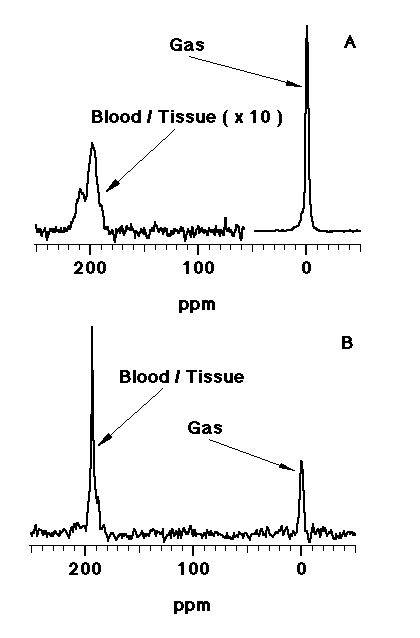
Figure 1. NMR spectra of laser-polarized ^129Xe in the entire rat body (A) and in the head (B). The gas phase resonance in each spectrum was set to 0 ppm and arised primarily from ^129Xe in the lungs in (A) and presumably from ^129Xe in the intubation tubing in (B). The blood/tissue resonance are observed in the whole body spectrum (A) at 197 and 211 ppm relative to the gas resonance. A single blood/tissue resonance is observed in the head spectrum (B) at 195 ppm relative to the gas resonance. The frequencies of the gas phase resonances in (A) and (B) are not necessarily the same and therefore chemical shifts in the two spectra cannot be compared.
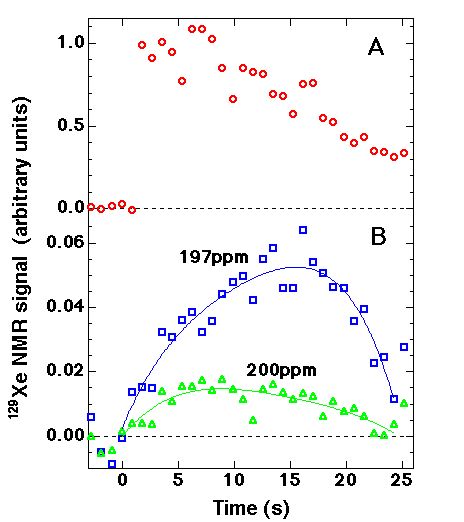
Figure 2. Uptake and washout data of ^129Xe NMR signal detected in the rat-body coil. t=0 seconds represents the beginning of ventilation with xenon for all data sets. The subject was ventilated with a 95%/5% O_2/CO_2 mixture prior to the introduction of xenon. NMR data acquisition was sychronized to the rat ventilator (65 bpm). (A) Area of gas phase NMR peak for whole body rat NMR signals. (B) Areas of chemically shifted blood/tissue NMR peaks at approximately 197 ppm and approximately 211 ppm for the whole body rat NMR signals. The solid curves are provided to guide the eye. (A) & (B) were taken during the same ventilation cycle.
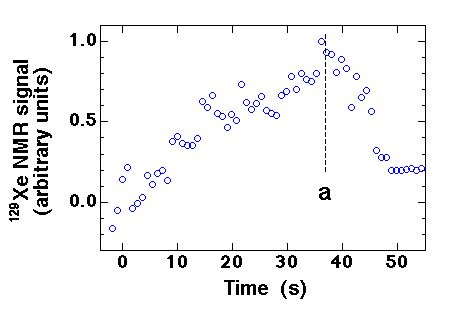
Figure 3. Uptake and washout data of the chemically shifted blood/tissue ^129Xe NMR signal detected in the rat-head coil. The xenon ventilation period lasted from t=0 to the time marked t'=37 seconds, with 95%/5% O_2/CO_2 mixture before and after xenon ventilation. An NMR spectrum was acquired every 900 ms.
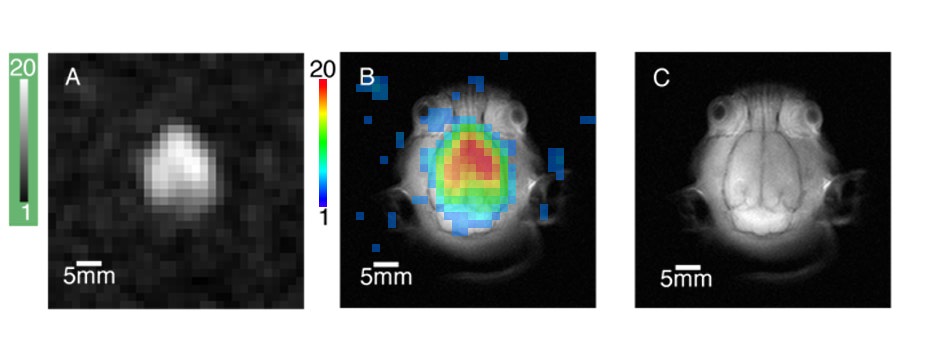
Figure 4. Horizontal ^129Xe and ^1H images of the rat brain. (A) Gray scale ^129Xe image illustrating the maximum SNR of about 20. (B) Direct superposition of a false color rendition of the ^129Xe image with SNR threshold set at 3:1 onto the ^1H image showing that the ^129Xe signal arises entirely from within the brain as well as reduced ^129Xe in the cerebellum. (C) ^1H spin-echo image (TR 600ms, TE 20ms). The field of view in each image is 50 mm x 50 mm with 10 mm slice thickness for both ^129Xe and ^1H images.
For further information, send email to: boltman@oahu.physics.lsa.umich.edu.