BME 332: Introduction to Biosolid Mechanics
Section 11: Blood Vessel Structure-Function
I. Overview
Although we don't often view them in this context, blood vessels are subject to mechanical stress during the pumping of blood. Thus, blood vessels must have mechanical properties that can withstand these stresses. Again, the mechanical properties of blood vessels are a function of the underlying tissue structure. Since blood vessels are soft collagenous tissues (with a good deal of elastin, another biomolecule), their stress-strain behavior resembles that of other soft collagenous tissues like ligaments and tendons. Thus, we can approximate their behavior under cyclic stress as pseudoelastic, nonlinear material, which implies hyperelasticity modeling. In addition, it seems that blood vessels like other biological tissues like to live in a homeostatic stress/strain range. Values of stress/strain outside of this range will lead to adaptation and changes in the tissue structure. In this section, we will give a brief overview of blood vessel structure, followed by an overview of modeling blood vessels as hyperelastic materials and the relationship of blood vessel properties to their structure, and finally, a description of mechanically mediated adaptation of blood vessels.
II. Blood Vessel Structure
In general the circulatory system of blood vessels may be broken down into those vessels that deliver oxygenated blood to tissues: the arteries, arterioles, and capillaries, and those vessels that return blood with carbon dioxide for gas exchange: the veins and venules. The basic structure of all these vessels can be broken down into three layers:
1. The Intima
2. The Media
3. The Adventia
It is the materials that make up these layers and the size of these three layers themselves that differentiates arteries from veins and indeed even one artery from another artery or one vein from another vein. A schematic from Fung's "Mechanical Properties of Living Tissues" shown below gives an overview of the different structures in the different types of blood vessels:
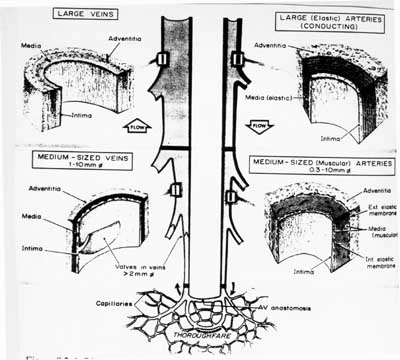
Although a little bit difficult on the reproduced schematic, arteries have a large media layer than veins. Since smooth muscle is generally found in the media layer, this means that arteries have more smooth muscle to contract than do veins. Arteries have a higher amount of elastin than veins. Thus, veins have a higher ratio of collagen to elastin than do arteries. In addition, veins have a thicker adventia layer in proportion to the media layer than do arteries.
Here is the composition of each layer of a blood vessel:
Intima:
Innermost layer
Contains endothelial cells
Basal lamina (80 nm thick)
Subendothelia layer with collagenous bundles, some elastin
Media:
Middle Layer
Contains mainly smooth muscle cells
Collagenous fibrils (type III collagen)
Divided from adventia by elastin layer (elastin is a protein which is very elastic, can undergo a
stretch ratio of 1.6, about 80% strain)
Adventia:
Outermost layer
Collagen fibers (mainly type III, differ in amino acid sequence from I and II)
Ground substance
Fibroblasts
The intima typical consists of a single layer of endothelial cells and an underlying 0.08 micron thick basal lamina. The endothelial cells are 0.2 to 0.5 microns thick, 10 to 15 microns wide and 20 to 50 microns long. The basal lamina consists largely of type 4 collagen, laminin, fibronectin, and some proteoglycans.
The media contains smooth muscle cells and smooth muscle tissue, and contains 5 to 15 microns thick concentric layers. A large artery may contain 40 to 70 layers, meaning the media may be from between 200 microns a little over 1 mm thick. The number of concentric layers and thus media thickness increases with increasing artery diameter. One rule of thumb proposed is that the media increases in thickness 50 microns for every 1mm of artery diameter.
The outermost layer, the adventia, is 10% and 50% of the thickness in elastic and muscular arterial walls. It consistes primarily of type I collagen fibers with some elastin and and fibroblasts.
An example of the percentage of all the components is given below in a table from Fung:
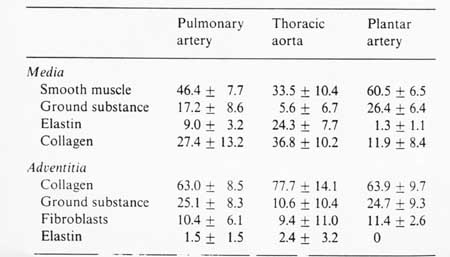
Humphrey (2002) further broke down arteries into elastic arteries, with larger diameters that tended to be closer to the heart, and muscular arteries, which had smaller diameter and tended to be farther away from the heart. The Elastic arteries included the aorta, pulmonary artery, common carotids, and common iliac artery. The muscular arteries include external carotid.
III. Blood Vessel Mechanical Characterization and Structure-Function
Once we know something about tissue structure, the next natural question is: How does this structure contribute to mechanical function? If we view the mechanical behavior of blood vessels using the typical non-linear soft tissue stress strain curve, we can make qualitative statements about how tissue constituents affect mechanical behavior. Roach and Burton in 1957 digested collagen out of blood vessels using trypsin, and digested elastin from blood vessels using formic acid. They found that collagen contributed mainly to the toe region of the nonlinear stress-strain curve while elastin contributed mainly to the linear part of the stress-strain curve. We can see this in stress strain curve from a human vena cava below:
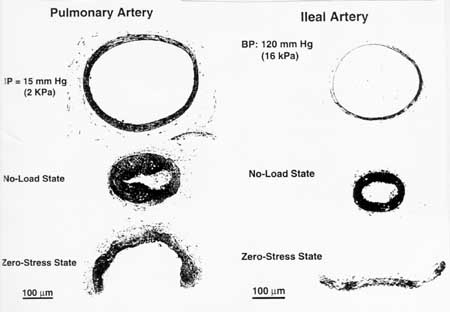
Another critical aspect of blood vessel behavior is residual stress. This means that even in the unloaded state, there is still stress in the artery. This state of residual stress is dependent on the thickness and the composition of the artery. In fact, as arteries are remodeled in response to mechanical stress, the amount of residual stress changes, as we will see in the section on mechanically mediated vessel adaptation. A mark of the amount of residual stress is how much the blood vessel will open when cut. Since the blood vessel is under stress, when we cut the vessel, the stress holding the vessel together is removed and the blood vessel springs open. A figure from Fung below shows that different amounts of residual stress are present in different arteries:
If we desire a more quantitative description of blood vessel mechanics than toe versus linear region, than we can model the blood vessel as a pseudoelastic material using hyperelastic strain energy functions. In that case, the blood vessel is often described as a cylinder, with stress and strain represented using cylindrical coordinates. We use the 2nd Piola-Kirchoff stress tensor and Green-Lagrange strain tensor to represent the stress and strain in the blood vessel, respectively. These are denoted below:
The tests used to impose these stress/strain states are torsion (![]() ), internal pressue (
), internal pressue (![]() ), and longitudinal stretch (
), and longitudinal stretch (![]() ).
).
An example of a test set-up to test blood vessels from Fung's laboratory is shown below:
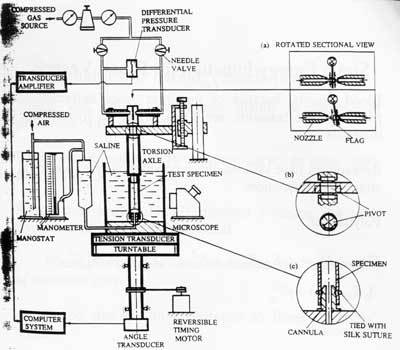
The test set-up allows for torsional, tensile and pressure testing. The blood vessel itself must be kept in a saline bath during testing.
Of course, when performing these tests we need to have a constitutive model in mind to describe the tissue mechanical behavior. For a hyperelastic model, we need to use a strain energy function. For blood vessel mechanics, there are two types of strain energy functions often used. The first form often used is the polynomial form, given below in terms of cylindrical Green-Lagrange strain components:
![]()
where A1 through A7 are material constants and the strains are the same as those described above. The second form uses an exponential function:
![]()
The above forms neglect shear stress, assuming a very thin vessel. To calculate the stress components, we differentiate the strain energy function with respect to the strain components:
As can be expected from differences in tissue structures, there are differences in the constants for the strain energy functions for different arteries.
Plotting Nonlinear Stress Strain Curves using MATLAB:
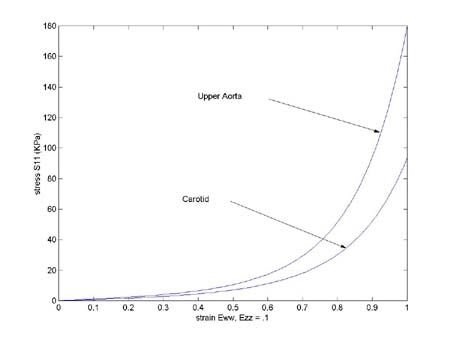
To gain some insight into how the coefficients in the strain energy function affect the shape of the stress strain curve, we will use MATLAB to plot the stress strain curve for the Carotid and Aorta arteries modeled using a polynomial strain energy function. The strain energy function is shown below:
To obtain the 2nd Piola-Kirchoff stress component Sqq, we differentiate the strain energy function with respect to Eqq (we can also get Szz by differentiating W with respect to Ezz):
To plot Sqq in MATLAB, we write a program in a .m file called ves1plot, as shown below:
eww = (0:99)/99;
ezz = .1*ones(1,100);
for i = 1:100
sww(i) = 2.93*(2.5*eww(i)+.176*ezz(i))*exp(2.5*eww(i)*eww(i)+...
.46*ezz(i)*ezz(i)+2.*.176*eww(i)*ezz(i));
end
plot(eww,sww)
xlabel('strain Eww, Ezz = .1')
ylabel('stress S11 (KPa)')
hold on
for i = 1:100
sww(i) = 3.39*(2.8*eww(i)+.58*ezz(i))*exp(2.8*eww(i)*eww(i)+... .52*ezz(i)*ezz(i)+2.*.58*eww(i)*ezz(i));
end
plot(eww,sww)
where eww and sww are eqq and sqq respectively. We first create an array of strains with eww = (0:99)/99. We fix the ezz strain at 10%. This illustrates a very important aspect of nonlinear stress strain relationships. The amount of strain in one direction can influence uniaxial strain in the other direction. Let us use the following constants in the above stress relation for the plot:
Artery C (KPa) a1 a2 a4
Carotid 2.9 2.5 .46 .176
Upper Aorta 3.38 2.8 .52 .58
We we run the above code, we obtain the following plots, where the upper curve is the aorta and the lower curve is the carotid artery:
To see the senstivity of stress derived from the strain energy function to the parameters in the strain energy function, we first vary the constant C, changing from 2.9 to 3.9. We get the plot shown below:
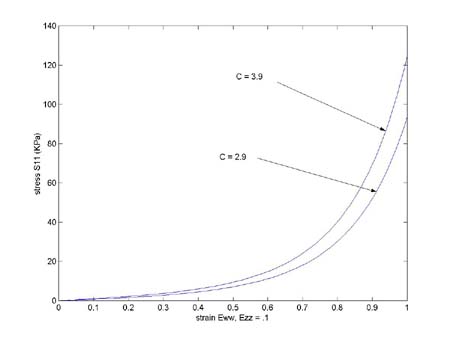
We see that C increasing C slightly shifts the curve to become stiffer, along almost the whole graft. If instead we increase a1 from 2.5 to 4.5, we get the following graph:
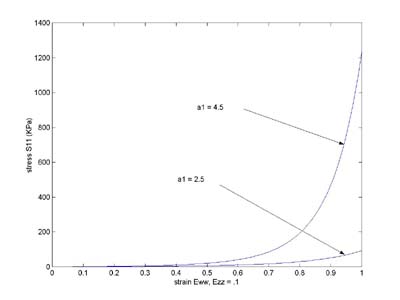
Here we see a dramatic stiffening of the material, especially in the linear zone. Although quantitative statistical results are not reported in the text, you can see that relating specific tissue attributes like the amount of collagen vs. elastin to constants in the strain energy function like C, a1, etc. are one way to characterize structure function in soft collagenous tissues, as long as we use consistent, the same strain energy functions.
In addition to derving strain energy functions for the whole blood vessel, Fung performed bending experiments on arteries and used composite beam theory to back out some constants for each layer. He found significant differences in the linear portion of the stress strain curve for the intima-media layer vs. the adventia layer. In the thoracic arteries of pigs, he found a modulus of 43.25 KPa for the intima-media layer but a modulus of only 4.7 KPa for the adventia layer. These results indicate that the difference in structure between the layers affects the mechanical properties.
III.A More Constitutive Models for the Aorta
In addition to the polynomial and exponential forms, Holzapfel and Weizacker (1998) proposed a combined polynomial and exponential form for a strain energy function for the aorta:

where c0 through c6 are experimental constants, with c0 having the dimensions of stress, typically KPa, and c1 through c6 being nondimensional parameters.
III.C Constitutive Model for Coronary Arteries
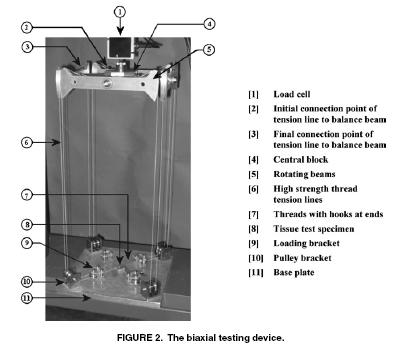
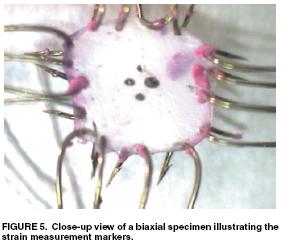
Despite their critical importance in cardiovascular health, especially for coronary artery disease, little information exists on the mechanics of coronary arteries. This is due in part to the difficulty in dissecting the coronary artery from heart muscle. Lally et al. (2004) performed one of the first experimental studies on coronary arteries from the pig, which have a cardiovascular system similar to humans. They used both axial and biaxial tension tests to measure the longitudinal and radial properties of the coronary artery. The device used for biaxial testing of the coronary artery is shown below:
Lally et al proposed an isotropic incompressible hyperelastic constitutitve model for the coronary artery similar to a general Mooney-Rivlin model:
where aij are experimental constants and I1 and I2 are the first and second invariant of the right Cauchy deformation tensor. The thrid invariant is equal to one due to incompressibility. Lally et al. proposed two specific forms of the general isotropic model. The first was:
The second was a reduced form known as the Signorini model:
To calculate the 2nd PK stress from the first form we take the derivative with respect to Cij. We can do this in MATLAB using the symbolic manipulator. The commands to do this are:
>> syms C11 C22 C12 C33 C13 C23
>> syms a10 a01 a11 a20 a30
>> syms i1 i2
>> i1 = C11 + C22 + C33
i1 =
C11+C22+C33
>> i2=0.5*((C11*C22-C21*C12)+(C22*C11-C12*C21)+(C33*C11-C13*C31)+...
(C11*C33-C31*C13)+(C22*C33-C32*C23)+(C33*C22-C23*C32))
i2 =
C11*C22-C21*C12+C33*C11-C13*C31+C22*C33-C32*C23
>> w=a10*(i1-3)+a01*(i2-3)+a20*(i1-3)^2+a11*(i1-3)*(i2-3)+a30*(i1-3)^3
w =
a10*(C11+C22+C33-3)+a01*(C11*C22-C21*C12+C33*C11-C13*C31+C22*C33-C32*C23-3)+a20*(C11+C22+C33-3)^2+a11*(C11+C22+C33-3)*(C11*C22-C21*C12+C33*C11-C13*C31+C22*C33-C32*C23-3)+a30*(C11+C22+C33-3)^3
>> s11=diff(w,'C11')
s11 =
a10+a01*(C22+C33)+2*a20*(C11+C22+C33-3)+a11*(C11*C22-C21*C12+C33*C11-C13*C31+C22*C33-C32*C23-3)+a11*(C11+C22+C33-3)*(C22+C33)+3*a30*(C11+C22+C33-3)^2
>> s22=diff(w,'C22')
s22 =
a10+a01*(C11+C33)+2*a20*(C11+C22+C33-3)+a11*(C11*C22-C21*C12+C33*C11-C13*C31+C22*C33-C32*C23-3)+a11*(C11+C22+C33-3)*(C11+C33)+3*a30*(C11+C22+C33-3)^2
>> s12=diff(w,'C12')
s12 =
-a01*C21-a11*(C11+C22+C33-3)*C21
Thus, we have the biaxial stress state as:


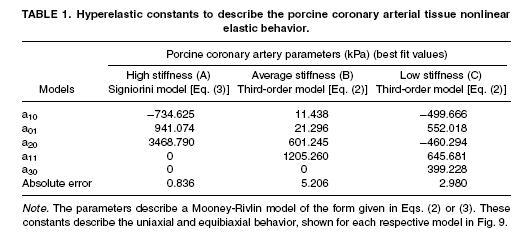
Lally et al. (2004) found the following experimental constants for high, average and low stiffness coronary arteries:
III. Mechanically and Disease mediated Blood Vessel Adaptation
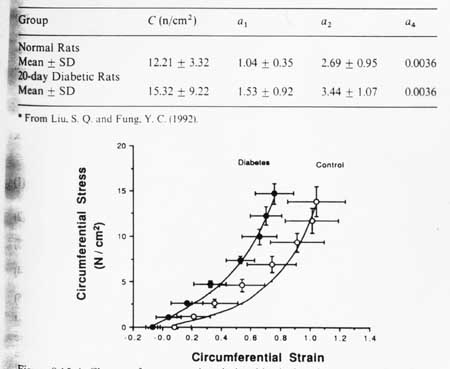
There primary ways that blood vessel tissue structure changes in through aging, disease, and change in mechanical load. Sometimes it is a combination of all three factors. For example, hypertension or high blood pressure is a disease that raises the mechanical load on the blood vessel. Due to higher stresses, the structure of the blood vessel is altered. One example of a disease that alters blood vessel structure and consequently mechanical properties is diabetes. An example of changes in mechanical properties due to diabetes is seen in rats after a single injection of stretozocin. Fung presents the changes in material properties based on the strain energy function shown below:
where a1, a2, a4, and C are material constants, and E11 and E22 are components of the Green-Lagrange strain tensor. Again, we obtain the second Piola-Kirchoff stress tensor if we differentiate the strain energy function with respect to the strain:

For the above strain energy function, we obtain the stress component S11 for example as:

were we see that stress is definitely a nonlinear function of strain with the higher order terms and the exponential. In the rats we diabetes, Fung and colleagues measured the material constants for the above strain energy function of the thoracic aorta artery in normal rats and those 20 days after the onset of diabetes. Although he did not report changes in tissue structure in the text, he noted profound changes in the nonlinear stress strain curve and the material constants in the strain energy function for the diabetic rats, with their aorta becoming stiffer, as shown below:
You will also note that the constants in the strain energy function change significantly. This indicates that we can use the material constants in proposed strain energy functions to quantify changes in blood vessel function due to changes in structure. Thus, the strain energy function becomes a conduit to quantify structure-function of soft collagenous tissues just as the anisotropic Hooke's law is a way to quantify bone structure function relationships.
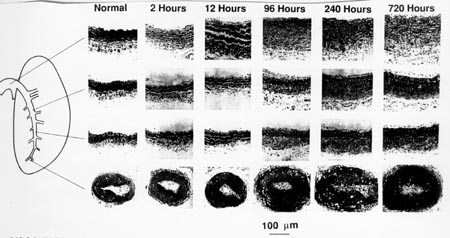
As we mentioned, increase in vessel mechanical stress due to increased blood pressure can cause changes in tissue structure and mechanical properties. Fung and Liu performed an experiment where they puts rats in a low oxygen chamber, similar to changes due to elevation. Nitrogen was added so that the total pressure was the same as that at sea level. They found that the systolic blood pressure increased from 2.0 KPa to 2.93 KPa within minutes after the rat was in the chamber. After one month, the pressure rose to 4.0 KPa. Histologically, they note significant changes in tissue structure of the pulmonary artery even after a few days. Even after a few hours, there are histological staining changes that indicate a change in the total amount of elastin in the vessel. After 12 hours, there is a significant thickening of the media layer in the pulmonary artery. After 96 hours the adventia has also experienced a significant increase in thickness. The histological changes that Fung saw are shown below:
In terms of mechanical properties, Fung reported the change in opening angle of the artery, a measure of the change in residual stress. They note that early after exposure to higher pressure, the residual stress in the artery was greater than that of the controls. However, after prolonger exposure, the residual stress, as measured by the opening angle decreased, indicating that the adaptation changes had reduced the residual stress.