Chen Lab Instrumentation
Sum Frequency Generational Vibrational Spectroscopy
We have two SFG systems!
First SFG
In new room.
Second SFG.
Introduction to SFG
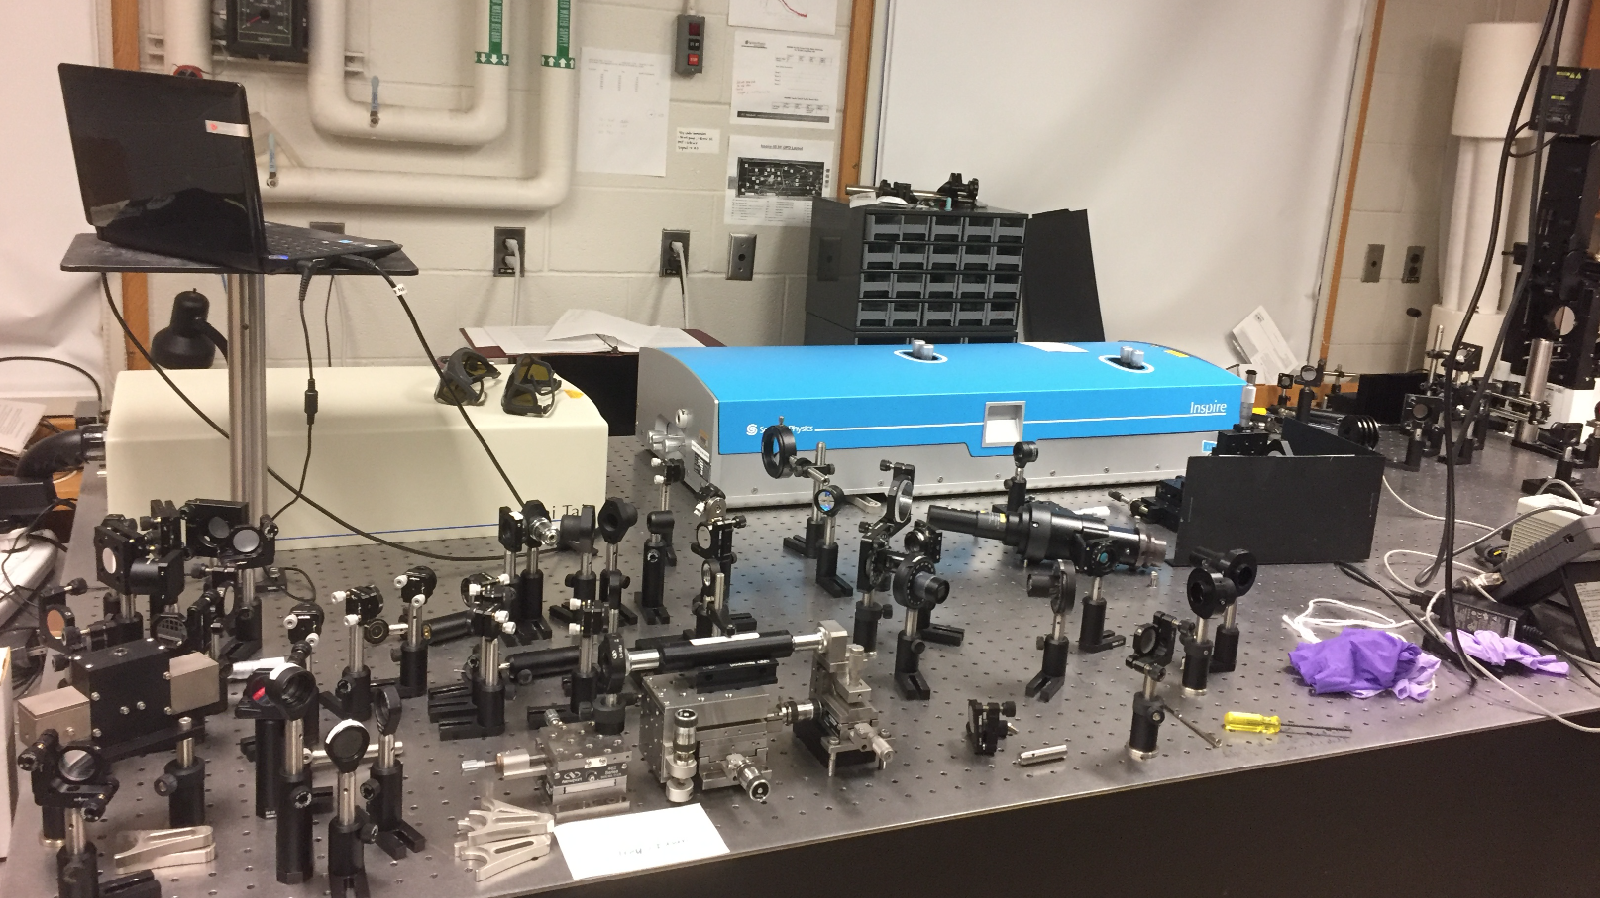
SFG is a process in which two input beams at frequencies w1 and w2 mix in a medium and generate an output
beam at the sum frequency w = w1 + w2. As a nonlinear optical process, it is only allowed under electric-dipole
approximation in media without inversion symmetry. At surfaces or interfaces, the inversion
symme
try of the
bulk is broken and therefore SFG is allowed. Both experimental evidence and calculations show that SFG is
submonolayer sensitive. For IR-visible SFG, w1, the IR input beam, is tunable. If it is scanned over a
vibrational resonance, SFG should be resonantly enhanced. A plot of SFG intensities vs. w1 produces the vibrational spectrum of the surface species. As SFG is a polarized
light experiment, the orientation of surface molecules can be deduced by using different polarization
combinations of input and output beams. Therefore, SFG not only permits identification of surface/interface
molecular species, but also provides information about surface/interface chemical structure, such as coverage,
orientation, and orientation distribution of surface/interface functional groups. The schematic SFG
experimental arrangement is depicted in Fig.1.
Our SFG setup is composed of four components (shown in Fig. 2): a pico-second Nd:YAG laser (PL2143A), a
harmonic unit with two KD*P crystals, an optical parametric generation (OPG)/optical parametric amplification
(OPA) and difference frequency generation (DFG) system (PG401VIR/DFG) based on LBO and AgGaS2 crystals, and a
detection system containing two channels: the signal channel and the reference channel. The visible beam
(532 nm) is generated by frequency-doubling the fundamental output pulses of 20 ps pulsewidth from the Nd:YAG
laser. The IR beam can be tuned from 1000 to 4300 cm-1(or 10 to 2.3 um), generated from the OPG/OPA and DFG
system. The incident angles of the visible and the IR input beams are 56° and 50° versus the surface normal,
respectively. The diameters of both visible and IR beams at the surface are about 500 um. The SFG signal from
the surface is collected by a photomultiplier and processed with a gated integrator. A separate photomultiplier
is used to
collect the bulk SFG signal from a ZnSe plate as a reference channel. Two photodiodes are used to monitor
the input visible beam and IR beam powers by collecting the back reflections of these two beams from focus
lenses. Therefore, SFG spectra from the sample surfaces can be normalized either by the reference signal from
ZnSe, or by the powers of the input laser beams. The sample stage can be manually adjusted to optimize the
alignment. It can also be moved or rotated automatically in the X-Y plane by step motors. We can monitor the
chemical homogeneity of the sample surface by mapping the SFG signals while continuously tuning these computer
controlled step motors.
Our SFG system can be used to collect CARS and FWM spectra. Polarized CARS spectra study can be achieved. This provides additional measurement for third order nonlinear susceptibility.
Atomic Force Microscopy
More pictures of the AFM.
Introduction to AFM
AFM operates by measuring attractive or repulsive forces between a tip and the sample (Fig. 3). In its "contact" mode, the instrument lightly touches a tip at the end of a leaf spring or "cantilever" to the sample. As a raster-scan drags the tip over the sample, the detection apparatus measures the vertical and horizontal deflections of the cantilever. Therefore, morphology and frication images of the surface can be obtained.
MAC mode uses an oscillating magnetic field to drive the AFM cantilever. A magnetic film on the cantilever gives it a very strong response to the driving field. This magnetic field is generated by a solenoid placed under the sample. Driving the lever in this method eliminates spurious responses generated by the cantilever holding mechanism, the fluid body, and the sample itself. The AFM tip gently taps the surface when it scans over the surface. MAC mode provides morphology and adhesion images of the surface.
Other Instruments
Fourier Transform Infrared Spectrometer
Contact Angle Goniometer
Adhesion Tester

Instron 5544 mechanical testing instrument. This can be used to study different model epoxies such as PDMS or PDPS, before and after moisture exposure or mixing with silanes.
Langmuir-Blodgett Trough
Glow Discharge Plasma Treatment
Quartz Crystal Microbalance
(no picture)
FWM Spectrometer/ CARS imaging

Digital Holographic Imaging


