Linear Regression
Note: The datafile containing the data for this regression can be found on the homepage for this report.
Regression Results:
Y value is % of population under four years old
| Factor | Coefficient | P-value |
| Intercept | .133 | 1.37E-6 |
| % Females Econ. Active | .296 | .0422 |
| % Females Literate | -.134 | .000476 |
| % Muslim | .053 | .0179 |
| % Urban | -.052 | .0267 |
Adjusted R Square = .363
Conclusions:
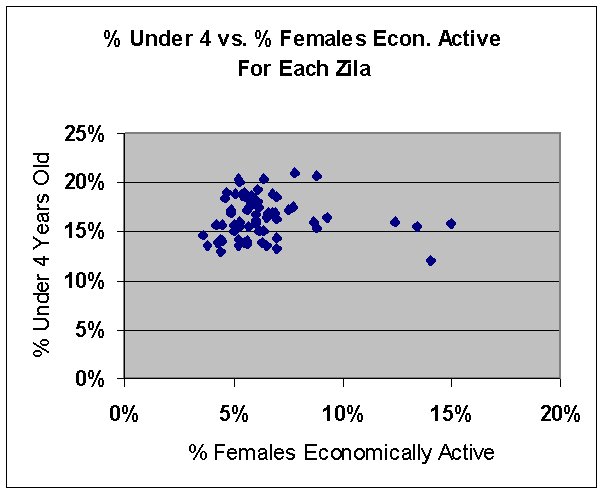
All findings agree with our expectations except the last one. The graph below shows how the percent of economically active women and percent children compare for each zila (local region). Due to the low predictive quality of the regression, this anomoly should be ignored in favor of more robust local research which has shown a negative correlation between the two. There is no obvious visual relationship between these two variables. It should, however, be noted that this factor may not be as predominant as otherwise thought.