Professional Reference Shelf
R3.1 Collision Theory
- Overview
- Fundamentals of Collision Theory
- Shortcoming of Collision Theory
- Modifications of Collision Theory
- Distribution of Velocities
- Collisions Resulting in Reaction
- Model 1 Pr = 0 or 1
- Model 2 Pr = 0 or Pr = (E-EA)/E
- Other Definitions of Activation Energy
- Tolman
- Fowler and Guggenheim
- Barrier Height and Potential Energy Surfaces
- Polyani Equation
- Problems
- Closure
I. Overview Collision Theory
|
In Chapter 3 we presented a
number of rate laws that depended on both concentration and temperature. For the elementary reaction
A + B  C + D C + D
the elementary rate law is

We want to provide at least a qualitative understanding as to why the rate law takes this form. We
will first develop the collision rate, using collision theory for hard spheres of cross section
Sr,  When all
collisions occur with the same relative velocity, UR the number of collisions
between A and B molecules, When all
collisions occur with the same relative velocity, UR the number of collisions
between A and B molecules,  , is , is
 {collisions/s/molecule]
Next we will consider a distribution of relative velocities and only consider those collisions that
have an energy of EA or greater in order to react to show

where

with  AB = collision radius, kB = Boltzmann's constant, AB = collision radius, kB = Boltzmann's constant,  AB = reduced mass,
T = temperature and NAvo = Avogadro's number. To obtain an
estimate of EA, we use the Polyani Equation AB = reduced mass,
T = temperature and NAvo = Avogadro's number. To obtain an
estimate of EA, we use the Polyani Equation

Where  HRx is the heat
of reaction and HRx is the heat
of reaction and  and and  P are the Polyani Parameters. With these
equations for A and EA we can make a first approximation to the rate law
parameters without going to the lab. P are the Polyani Parameters. With these
equations for A and EA we can make a first approximation to the rate law
parameters without going to the lab.
|
References for Collision Theory, Transition State Theory and Molecular Dynamics
P. Atkins, Physical Chemistry, 6th ed. (New York: Freeman, 1998)
P. Atkins, Physical Chemistry, 5th ed. (New York: Freeman, 1994).
G. D. Billing and K. V. Mikkelsen, Introduction to Molecular Dynamics and Chemical
Kinetics (New York: Wiley, 1996).
P.W. Atkins, The Elements of Physical Chemistry, 2nd ed. (Oxford: Oxford Press, 1996).
K. J. Laidler, Chemical Kinetics, 3rd ed. (New York: Harper Collins, 1987).
G. Odian, Principles of Polymerization, 3rd ed. (New York: Wiley 1991).
R. I. Masel, Chemical Kinetics and Catalysis, Wiley Interscience, New York, 2001.
As a short hand notation we will use the following references nomenclature
A6p701 Means Atkins, P. W. Physical Chemistry, 6th ed. (1998) page 701.
L3p208 Means Laidler, K. J., Chemical Kinetics, 3rd,ed. (1987) page 208.
This nomenclature means that if you want background on the principle, topic, postulate,
or equation being discussed, go to the specified page of the text referenced.
II. Fundamentals of Collision Theory
The objectives of the development that follows are to give the reader insight as to why the
rate laws depend on the concentration of the reacting species (i.e., rA =
kCACB) and why the temperature dependence is
the form of the Arrhenius law, k=Ae/RT. To achieve this goal we consider
the reaction of two molecules in the gas phase
A + B  C + D
C + D
We will model these molecules as rigid spheres.
sA and sB,
respectively

Figure PRS.3A-1
Schematic of molecules A and B
We shall define our coordinate system such that molecule B is stationary wrt molecule A so
that molecule A moves towards molecule B with a relative velocity UR. Molecule A
moves through space to sweep out a collision volume with a collision cross section  illustrated by the cylinder shown below.

Figure PRS.3A-2 Schematic of collision cross section
The collision radius is  .
.

If the center of a "B" molecule comes within a distance of  of the center of the "A" molecule they will collide.The
collision cross section of rigid spheres is Sr
  . As a first approximation we shall consider Sr constant. This constraint will be relaxed when we consider a distribution of relative
velocities. The relative velocity between two gas molecules A and B is UR.1
 (1)
(1)
where
kB = Boltzmann's constant = 1.381 X 10⁻²³J/K/molecule
= 1.381 kg m2/s2/K/molecule
mA = mass of a molecule of species A (gm)
mB = mass of a molecule of species B (gm)
μAB = reduced mass =  (g), [Let μ
  μAB]
μAB]
MA = Molecular weight of A (Daltons)
NAvo = Avogadros' number 6.022 molecules/mol
R = Ideal gas
constant 8.314 J/mol•K = 8.314 kg • m2/s2/mol/K
We note that R = NAvo kB and MA =
NAvo • mA, therefore we can write the ratio (kB/ AB) as
 (2)
(2)
An order of magnitude of the relative velocity at 300 K is  , i.e., ten times the speed of Indianapolis 500 Formula 1 car. The
following collision diameter and velocities at 0°C are given in Table PRS.3A-1
Table PRS.3A-1 Molecular Diameters2
|
Molecule
|
Average Velocity,
(meters/second)
|
Molecular Diameter (Å)
|
|
H2
|
1687
|
2.74
|
|
CO
|
453
|
3.12
|
|
Xe
|
209
|
4.85
|
|
He
|
1200
|
2.2
|
|
N2
|
450
|
3.5
|
|
O2
|
420
|
3.1
|
|
H2O
|
560
|
3.7
|
|
C2H6
|
437
|
5.3
|
|
C6H6
|
270
|
3.5
|
|
CH4
|
593
|
4.1
|
|
NH3
|
518
|
4.4
|
|
H2S
|
412
|
4.7
|
|
CO2
|
361
|
4.6
|
|
N2O
|
361
|
4.7
|
|
NO
|
437
|
3.7
|
Consider a molecule A moving in space. In a time  t
the volume
t
the volume  V swept out by a molecule of A is


Figure PRS.3A-3 Volume
swept out by molecule A in time Dt
The bends in the volume represent that even though molecule A may change directions upon
collision the volume sweep out is the same. The number of collisions that will take place will be equal to the number
of B molecules,  V
V , that are in the volume swept out by the "A" molecule,
i.e.,

where  is in
is in  rather than [moles/dm3]
In a time  t the number of collisions of this one A
molecules with many B molecules is
  . The number of
collisions of this one A molecule with all the "B" molecules per unit time is
 (3)
(3)
However, we have many A molecules present at a concentration  , (molecule/dm3). Adding up the
collisions of all the A molecules per unit volume,
  , then the number of collisions
  of all the A molecules with all B molecules per time per unit volume
is
 (4)
(4)
Where Sr is the collision cross section
(Å)2. Substituting for Sr and
UR
 [molecules/time/volume]
(5)
If we assume all collisions result in reactions then
 [molecules/time/volume]
(6)
Multiplying and dividing by Avogadros number, NAvo, we can put our equation for the rate of reaction in terms of the number of
moles/time/vol.
 (7)
(7)
 (8)
(8)
where A is the frequency factor
 (9)
(9)
 (10)
(10)
EXAMPLE: Calculate the frequency factor A for the reaction

at 273K.
Additional Information
Using the values in Table PRS.3A-1
Collision Radii
Hydrogen H  H=2.74 Å/4 = 0.75Å = 0.68 x 10¹⁰m
Oxygen O2  Å 1.55Å = 1.5 x
1010m

Solution
 (E)
(E)
 (9)
(9)
 (1)
(1)
Calculate the ratio (kB/ AB) (Let


 AB)
AB)


Calculate the relative velocity
 (A)
(A)

 (B)
(B)
 (C)
(C)

 (D)
(D)
The value reported in Masel3 (p367) from Westley is
A=1.5*1014 (Å)3/molecule/s
Close, but no cigar as Groucho Marx would say.
For many simple reaction molecules the calculated frequency factor, Acalc is in good agreement with
experiment. For other reactions, Acalc, can be an order of magnitude too high or
too low. In general, collision theory tends to over predict the frequency factor A

Terms of cubic angstroms per molecule per second the frequency factor is

There are a couple of things that are troublesome about the rate of reaction given by
Equation (10), i.e.
 (10)
(10)
First and most obvious is the temperature dependence. A is proportional to the square root of
temperature and so therefore is rA, i.e.

However we know that the temperature dependence of the rate of chemical reaction on
temperature is given by the Arrhenius equation
 (11)
(11)
or
 (12)
(12)
This shortcoming of collision theory along with the assumption that all collisions result in
reaction will be discussed next.
III. Shortcomings of Collision Theory
A. The collision theory outlined above does not account for orientation of the collision,
front to back and along the line-of-centers. That is, molecules need to collide in the correct orientation for
reaction to occur. Figure PRS.3A-4 shows molecules colliding whose centers are off set by a distance b.

Figure PRS.3A-4 Grazing
collisions
B. Collision theory does not explain activation barriers. Activation barriers occur because bonds need
to be stretched or distorted in order to react and these processes require energy. Molecules must overcome
electron-electron repulsion in order to come close together4
C. The collision theory does not explain the observed temperature dependence given by Arrhenius Equation

D. Collision theory assumes all A molecules have the same relative velocity, the average one.
 (1)
(1)
However there is a distribution of velocities f(U,T). One distribution most used is the
Maxwell-Boltzmann distribution.
IV. Modifications of Collision Theory
We are now going to account for the fact that we have (1) a distribution of relative
velocities UR and (2) that not all collisions result in a reaction, only those
collisions with an energy EA or greater. The goal is to arrive at

A. Distribution of Velocities
We will use the Maxwell-Boltzmann Distribution of Molecular Velocities (A6p.26). For a species of mass m, the Maxwell
distribution of velocities (relative velocities) is
 (13)
(13)
A plot of the distribution function, f(U,T), is shown as a function of U in Figure PRS.3A-5.

Figure PRS.3A-5
Maxwell-Boltzmann distribution of velocities
Replacing m by the reduced mass  of two molecules
A and B.

The term on the left hand side of Equation (13), [f(U,T)dU] is the fraction of A molecules with relative
velocities between U and (U + dU). Recall from Eqn. (4) that the number of AB collisions for a reaction cross
section Sr is
 (14)
(14)
except now the collision cross section is a function of the relative velocity.
Note we have written the
collision cross section Sr as a function of velocity U, i.e., Sr(U). Why does the velocity enter into reaction cross section, Sr' Because not all collisions are head on, and those that are not, will not react if the
energy, (i.e., U2/2 ), is not sufficiently
high. Consequently, this functionality, Sr = Sr(U), is reasonable because if two molecules collide with a very very low relative velocity it is
unlikely that such a small transfer of kinetic energy is likely to activate the internal vibrations of the molecule
to cause the breaking of bonds. On the other hand for collisions with large relative velocities most collision will
result in reaction.
We now let k(U) be the
specific reaction rate for a collision and reaction of A-B molecules with a velocity U.
 (15)
(15)
Equation (15) will give the specific reaction rate and hence the reaction rate for
only those collisions with velocity U. We need sum up the collisions of all velocities. We will use the
Maxwell Boltzmann distribution for f(U,T) and integrate over all relative velocities.
 (16)
(16)
Maxwell distribution function of velocities for the A/B pair of reduced mass  is5
is5
 (17)
(17)
Combining Equations (16) and (17)
 (18)
(18)
We let Sr=Sr(U) for
brevity. We will now express the distribution function in terms of the translational energy  T.
T.
We are now going to
express the equation for  . Equation (18) in terms of kinetic
energy rather than velocity. Relating the differential translational kinetic energy,
  t, to the velocity U.

noting and multiplying and dividing by  and
and  we obtain

and hence the reaction rate

Simplifying

 (19)
(19)

Multiplying and dividing by kBT and noting
 , we obtain
 (20)
(20)
Again recall the tilde, i.e.,  denotes that the specific reaction rate is per molecule
(dm3/molecule/s). The only thing left to do is to specify the reaction cross
section, Sr(E) as a function of kinetic energy E for the A/B pair of
molecules.
B. Collisions that Result in Reaction
We now modify the hard sphere collision cross section to account for the fact that not all
collisions result in reaction. Now we define Sr to be the reaction cross section
defined as

Where Pr is the probability of reaction. In the first
model we say the probability is either 0 or 1. In the second model Pr varies from
0 to 1 continuously. We will now insert each of these modules into Equation (20).
B.1 Model 1
In this model we say only those hard collisions that have kinetic energy EA or greater will react. Let E 
 t. That is, below this energy,
EA, the molecules do not have sufficient energy to react so the reaction cross
section is zero, Sr=0. Above this kinetic energy, all the molecules that collide
react and the reaction cross section is


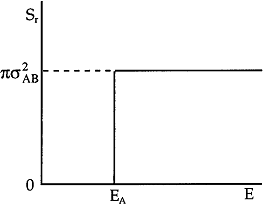
Figure PRS.3A-6 Reaction cross section for Model 1
Integrating Equation (20)
by parts for the conditions given by Equations (21) and (22) we obtain
 (23)
(23)


Generally
 , so
, so

Converting  to a per mole basis
rather than a per molecular basis we have


The good news and the bad news. This model gives the correct temperature dependence but
predicted frequency factor A' is even greater than A given by Eqn. (9) (which itself is
often too large) by a factor (EA/RT). So we have solved one problem, the correct
temperature dependence but created another problem, too large a frequency factor. Let's try Model 2.
B.2 Model 2
In this model we again assume that the colliding molecules must have an energy
EA or greater to react. However, we now assume that only the kinetic energy
directed along the line of centers E<<, is important. So below
EA the reaction cross section is zero, Sr=0.
The kinetic energy of approach of A towards B with a velocity UR is E =  AB
AB  . However, this model assumes that only the kinetic energy directly along
the line of centers contributes to the reaction.
(Click Back 2)
Here, as E increases above EA the number of collisions
that result in reaction increases. The probability for a reaction to occur is6
 (24)
(24)
and


A plot of the reaction cross section as a function of the kinetic energy of approach,

is shown in Figure PRS.3A-7.

Figure PRS.3A-7 Reaction
cross section for Models 1 and 2
Recalling Equation (20)
 (26)
(26)
Substituting for Sr in Model 2
 (27)
(27)
Integrating gives


Multiplying by Avogodro's number

 (28)
(28)
Which is similar to the equation for hard sphere collisions except for the term

 (29)
(29)
This equation gives the correct Arrhenius dependence and the correct order of magnitude for
A.
 (11)
(11)
Effect of Temperature on Fraction of Molecules Having Sufficient Energy to React
We now will manipulate and
plot the distribution function to obtain a qualitative understanding of how temperature increases the number of
reacting molecules. Figure PRS.3A-8 shows a plot the distribution function given by Equation (17) after it has been
converted to an energy distribution.
We can write the
Maxwell-Boltzmann distribution of velocities

in terms of energy by letting  to obtain


Fraction of collisions that have EA or above

This integral is shown by the shaded area on Figure PRS.3A-8
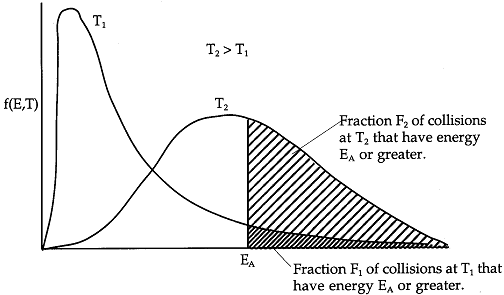
Figure PRS.3A-8
Boltzmann distribution of energies
As we just saw only those
collisions that have an energy EA or greater result in reaction. We see form
Figure PRS.3A-10 that the higher the temperature the greater number of collision result in reaction.
However, this Equations
(9) and (11) cannot be used to calculate A for a number reactions because of steric factors and the molecular
orientation upon collision need to be considered. For example, consider a collision in which the oxygen atom, O, hits
the middle carbon in the reaction to form the free radical on the middle carbon atom CH3 HCH3
HCH3
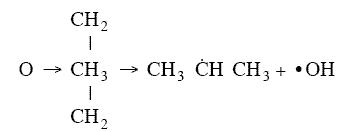
Otherwise if it hits anywhere else, say the end carbon,  will not be formed7


Consequently, collision theory predicts a rate 2 orders of magnitude too high for the
formation of CH3 HCH3.
HCH3.
V. Other Definitions of Activation Energy
We will only state other definition is passing, except for the energy barrier concept which
will be discussed in transition state theory.
A. Tolman's Theorem Ea =
E*


The average transitional energy of a reactant molecule is  .
.
B. Fowler and Guggenheim

C. Energy Barrier
The energy barrier concept will be discussed in transition state theory, Ch3 Profession
Reference Shelf B.


Figure PRS.3A-9
Reaction coordinate diagram
For simple reactions the energy, EA, can be estimated from
computational chemistry programs such as Cerius2 or Spartan, as the heat of
reaction between reactants and the transition state

VI. Estimation of Activation Energy From the Polyani equation
A. Polyani Equation
The Polyani equation correlates activation energy with heat of reaction. This correlation
 (33)
(33)
works well for families of reactions. For the reactions

where R = OH, H, CH3 the relationship is shown below in Figure PRS.3A-10.
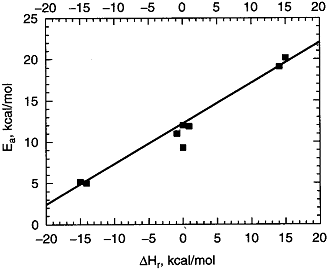
Figure PRS.3A-10
Experimental correlation of EA and  HRx from
Masel (Lit cit). Courtesy of Wiley.
For this family of reactions
 (34)
(34)
For example, when the exothermic heat of reaction is

The corresponding activation energy is

To develop the Polyani equation we consider the elementary exchange reaction8

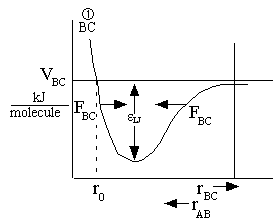
We consider the superposition of two attraction/repulsion potentials VBC, VAB similar to the Lennard-Jones 6-12 potential. For the
molecules BC, the Lennard-Jones potential is
 (35)
(35)
rBC = Distance between molecules (atoms) B and C.
In addition to the
Lennard-Jones 6-12 model, another model often used is the Morse potential which has a similar shape
 (36)
(36)
When the molecules are far
apart the potential V (i.e., Energy) is zero. As they move closer together they become attracted to one another and
the potential energy reaches a minimum. As they are brought closer together the BC molecules begin to repel each
other and the potential increases. Recall that the attractive force between the B and C molecules is
 (37)
(37)
The attractive forces between the BC molecules are shown in Figure PRS.3A-11.
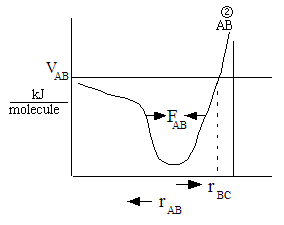
A potential similar to
atoms B and C can be drawn for the atoms A and B. The F shown on the figures represents the attractive force between
the molecules as they move in the direction shown by the arrows. That is the attractive force increase as we move
towards the well (ro) from both directions, rAB>ro and rAB<ro.
(a)
(b)
Figure PRS.3A-11 Potentials (Morse or
Lennard-Jones)
One can also view the reaction coordinate as a variation of the BC distance for a fixed AC
distance, l

For a fixed AC distance as B moves away from C the distance of separation of B from C,
rBC increases as N moves closer to A. See point (2) in Figure PRS.3A-11. As
rBC increases rAB decreases and the AB energy
first decreases then increases as the AB molecules become close. Likewise as B moves away from A and towards C
similar energy relationships are found. E.g., as B moves towards C from A, the energy first decreases due to
attraction then increases due to repulsion of the AB molecules as they come close together at point (2) in Figure
PRS.3A-11. The overlapping Morse potentials are shown in Figure PRS.3A-11. We now superimpose the potentials for AB
and BC to form the following figure
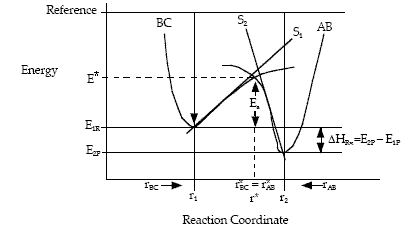
Figure PRS.3A-12 Overlap of potentials (Morse or Lennard-Jones)
Let S1 be the slope of the BC trajectory between
r1 and rBC = rAB = r*. Starting at E1R and r1,
the energy of BC, E1, at a separation distance of rBC
can be calculated from the product of the slope S1 and the distance from r1 at E1R.
 (38)
(38)
For Example, the energy, E1 (kJ/mol), of the BC molecule at a position rBC = 5 nm relative to r1 (2 nm) where E1R = -50 kJ/mol and S1 = 10 kJ/mol/nm is

Let S2 be the slope of the AB trajectory between
r2 and rBC=rAB = r*. Similarly for AB, starting on the product side at E2P, as the distance rAB increases the distance rBC decreases and the energy E2 at a distance rBC is
 (39)
(39)
We note when we move up the AB trajectory from E2P (-80 kJ/mol) toward E*, the distance between B and C, rBC, decreases and the slope is negative. The AB energy, E2, at a position rBC = 7 nm relative to r2 (10 nm) when S2 = -20 kJ/mol/nm is

At the height of the barrier, B is equal distant from A and C, i.e.
 (40)
(40)
Substituting for  and
and

 (41)
(41)
Rearranging
 (42)
(42)
 (43)
(43)
Solving for r* and substituting back into the Equation

yields

 (44)
(44)
Equation (8) gives the Polyani correlation relating activation energy and heat of reaction.
Values of  and gP for different reactions can be found in Table 5.4 on page 254 of
Masel. One of the more common correlations for exothermic and endothermic reactions are given on page 73 of
Laidler.
(1) Exothermic Reactions
 (45)
(45)
If 
then

(2) Endothermic Reactions
 (46)
(46)
If

then

Also see R. Masel Chemical Kinetics and Catalysis, page 603 to calculate the activation energy from the heat of reaction.
Szabo proposed an extension of Polyani
equation
 (47)
(47)

B. Marcus Extension of the Polyani Equation
In reasoning similar to developing the Polyani Equation Marcus shows (see Masel
pp.584-586)

C. Blowers-Masel Relation
The Polyani Equation will predict negative activation energies for highly exothermic reactions Blowers and Masel
developed a relationship that compares quite well with experiment throughout the entire range of heat of reaction for
the family of reactions

as shown in Figure PRS.3A-13
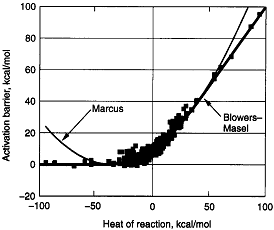
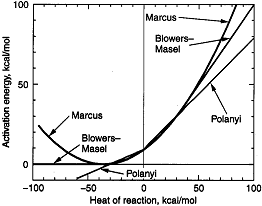
Figure PRS.3A-13
Comparison of models with data. From Masel.
Courtesy of Wiley
We see the greatest agreement between theory and experiment is found with the Blowers-Masel
model.
VII. Problems
Problems for Collision Theory
VIII. Closure
We have now developed a quantitative
and qualitative understanding of the concentration and temperature dependence of the rate law for reactions such
as
A + B  C + D
C + D
with
-rA = k CACB
We have also developed first estimates
for the frequency factor, A from collision theory

and the activation energy,
EA from the Polyani Equation

these calculated values for A and EA
can be substituted in the rate law to determine rates of reaction.

-
† This equation is given in most physical chemistry books, e.g., see Moore, W. J.
Physical Chemistry, 2nd Ed. P.187, Prentice Hall, Englewood Cliffs, NJ
-
† O'Hanlon, J. F., A User's Guide
to Vacuum Technology, Wiley, New York (1980)
-
† Masel, R. I. Chemical Kinetics and
Catalysis, p367, Wiley, New York (2001).
-
† Masel, R. I., lit. cit.
-
† Moore, lit. cit. p185, Atkins, P. W.
Physical Chemistry, 5th ed. p.36 (1994).
-
†Steinfeld, J. I., J. S. Francisco, and W. L.
Hayes, Chemical Kinetics and Dynamics, (p250) Prentice Hall, Englewood Cliffs NJ (1989).
Masel lit. cit. p483.
-
† Masel, lit. cit. p.36
-
† after R. I. Masel Lit cit., Chemical
Kinetics and Catalysis, Wiley, 2001
 C + D
C + D
 When all
collisions occur with the same relative velocity, UR the number of collisions
between A and B molecules,
  , is
, is {collisions/s/molecule]

 AB = collision radius, kB = Boltzmann's constant,
  AB = reduced mass,
T = temperature and NAvo = Avogadro's number. To obtain an
estimate of EA, we use the Polyani Equation
 HRx is the heat
of reaction and
  and
and  P are the Polyani Parameters. With these
equations for A and EA we can make a first approximation to the rate law
parameters without going to the lab.
 C + D
C + D
 illustrated by the cylinder shown below.
 .
.
 . As a first approximation we shall consider S
 (1)
(1) (g), [Let μ
  μ
μ (2)
(2) , i.e., ten times the speed of Indianapolis 500 Formula 1 car. The
following collision diameter and velocities at 0°C are given in Table PRS.3A-1

 , that are in the volume swept out by the "A" molecule,
i.e.,
 rather than [moles/dm
 . The number of
collisions of this one A molecule with all the "B" molecules per unit time is
 (3)
(3) , (molecule/dm
 , then the number of collisions
  (4)
(4) [molecules/time/volume]
(5)
 [molecules/time/volume]
(6)
 (7)
(7) (8)
(8) (9)
(9) (10)
(10)


 (E)
(E) (9)
(9) (1)
(1)

 (A)
(A)
 (B)
(B) (C)
(C)
 (D)
(D)


 (11)
(11) (12)
(12)


 (13)
(13)

 (14)
(14) (15)
(15) (16)
(16) is
is (17)
(17) (18)
(18)
 . Equation (18) in terms of kinetic
energy rather than velocity. Relating the differential translational kinetic energy,
 and
and 


 (19)
(19)
 , we obtain
 (20)
(20)


 (23)
(23)

 , so
, so

 to a per mole basis
rather than a per molecular basis we have

 . However, this model assumes that only the kinetic energy directly along
the line of centers contributes to the reaction.
 (24)
(24)


 (26)
(26) (27)
(27)

 (28)
(28)
 (29)
(29)
 to obtain


 will not be formed

 HCH
HCH

 .
.


 (33)
(33)

 (34)
(34)

 (35)
(35) (36)
(36) (37)
(37)


 (38)
(38)
 (39)
(39)
 (40)
(40) and
and

 (41)
(41) (42)
(42) (43)
(43)

 and
and  (45)
(45)

 (46)
(46)

 (47)
(47)


