"When a man blames others for his failures, it's a good idea to credit others with his successes."
--Howard W. Newton
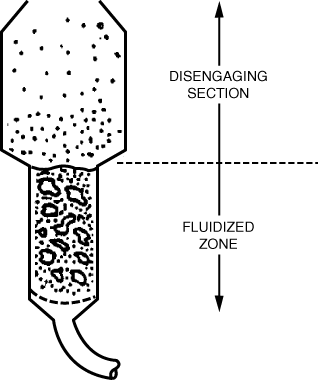
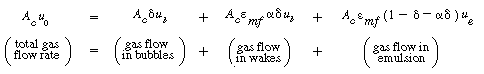
Figure CD12-2
From D. Kunii and O. Levenspiel, Fluidization Engineering (Melbourne, Fla.: Robert E. Krieger Publishing Co., 1969).
Reprinted with permission of the publishers.
CD12.3-A Descriptive Behavior of the Kunii-Levenspiel Bubbling Bed Model
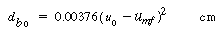
We are going to use the Kunii-Levenspiel bubbling-bed model to describe reactions in fluidized beds. In this model the reactant gas enters the bottom of the bed and flows up the reactor in the form of bubbles. As the bubbles rise, mass transfer of the reactant gases takes place as they flow (diffuse) in and out of the bubble to contact the solid particles, where the reaction product is formed. The product then flows back into a bubble and finally exits the bed when the bubble reaches the top of the bed. The rate at which the reactants and products transfer in and out of the bubble affects the conversion, as does the time it takes for the bubble to pass through the bed. Consequently, we need to describe the velocity at which the bubbles move through the column and the rate of transport of gases in and out of the bubbles. To calculate these parameters we need to determine a number of fluid-mechanics parameters associated with the fluidization process. Specifically, to determine the velocity of the bubble through the bed we first need to calculate:
The algorithm |
- Porosity at minimum fluidization,

- Minimum fluidization velocity,

- Bubble size, d b
-
Porosity at minimum fluidization,
- Minimum fluidization velocity,
- Velocity of bubble rise, U b
- Bubble size, db
- Fraction of the total bed occupied by bubbles,

- Fraction of the bed consisting of wakes,

- Volume of catalyst in the bubbles, clouds, and emulsion,
 b , c and e ,
) necessary to obtain the mass transfer and reaction parameters.In Section CD12.3.3, equations for the mass transfer parameters are developed. In Section CD12.3.4 the reaction-rate parameters are presented, and the mole balance equations are applied to the bed to predict conversion in Section CD12.3.5.CD12.3-B Mechanics of Fluidized Beds
In this section we describe the regions of fluidization and calculate the minimum and maximum fluidization velocities. Next, the Kunii-Levenspiel bubbling-bed model is described in detail. 9 Finally, equations to calculate the fraction of the bed comprising bubbles, the bubble size, the velocity of bubble rise, and the fractional volume of bubbles, clouds, and wakes are derived.
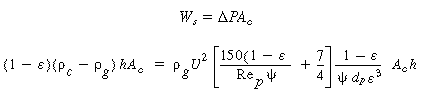
 c is the density of the solid catalyst particles, A c the cross-sectional area, h s the height of the bed settled before the particles start to lift, h the height of the bed at any time, and
  s and the corresponding porosities of the settled and expanded bed, respectively, then the mass of solids in the bed, W s, is
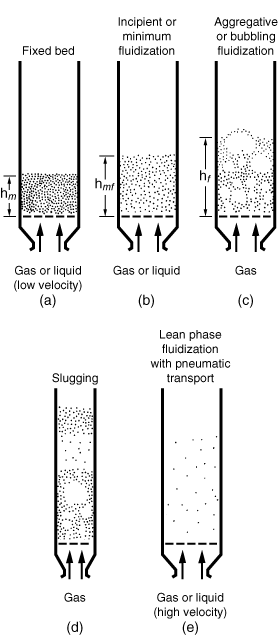
Figure CD12-3.1
Various kinds of contacting of a batch of solids by fluid.
Adapted from D. Kunii and O. Levenspiel, Fluidization Engineering (Melbourne, Fla.: Robert E. Krieger Publishing Co., 1977).
 = porosity, while in this section, = porosity.) This relationship is a consequence of the fact that the mass of the bed occupied solely by the solid particles is the same no matter what the porosity of the bed. When the drag force exceeds the gravitational force, the particles begin to lift and the bed expands (i.e., the height increases), thus increasing the bed porosity, as described by Equation (CD12-3.1). This increase in bed porosity decreases the overall drag until it is again balanced by the total gravitational force exerted on the solid particles (Figure CD12-3.1b).
If the gas velocity is increased still further, expansion of the bed will continue to occur; the solid particles will become somewhat separated from each other and begin to jostle each other and move around in a restless manner. Increasing the velocity just a slight amount causes further instabilities and some of the gas starts bypassing the rest of the bed in the form of bubbles (Figure CD12-3.1c). These bubbles grow in size as they rise up the column. Coincidentally with this, the solids in the bed begin moving upward, downward, and around in a highly agitated fashion, appearing as a boiling frothing mixture. With part of the gas bubbling through the bed and the solids being moved around as though they were part of the fluid, the bed of particles is said to be fluidized. It is in a state of aggregative, nonparticulate, or bubbling fluidization.
A further increase in gas velocity will result in slug flow (Figure CD12-3.1d) and unstable chaotic operation of the bed. Finally, at extremely high velocities the particles are blown or transported out of the bed (Figure CD12-3.1e).
The range of velocities over which the Ergun equation applies can be fairly large. On the other hand, the difference between the velocity at which the bed starts to expand and the velocity at which the bubbles start to appear can be extremely small and sometimes nonexistent. This observation means that if one steadily increases the gas flow rate, the first evidence of bed expansion may be the appearance of gas bubbles in the bed and the movement of solids. At low gas velocities in the range of fluidization, the rising bubbles contain very few solid particles. The remainder of the bed has a much higher concentration of solids in it and is known as the emulsion phase of the fluidized bed. The bubbles are shown as the bubble phase. The cloud phase is an intermediate phase between the bubble and emulsion phases.

 .The section of the figure where the pressure drop remains essentially constant over a wide range of velocities is the region of bubbling fluidization (section II:
 cm/s). Beyond this are the regions of fast fluidization and of purely entrained flow.
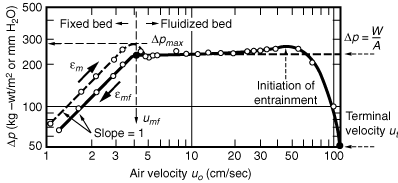
Figure CD12-3.2
From D. Kunii and O. Levenspiel, Fluidization Engineering
(Melbourne, Fla.: Robert E. Krieger Publishing Co., 1977). Reprinted with permission of the publishers.
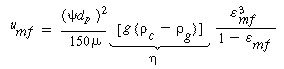
Fluidization will be considered to begin at the gas velocity at which the weight of the solids gravitational force exerted on the particles equals the drag on the particles from the rising gas. The gravitational force is given by Equation (CD12-3.1) and the drag force by the Ergun equation. All parameters at the point where these two forces are equal will be characterized by the subscript mf, to denote that this is the value of a particular term when the bed is just beginning to become fluidized. The combination g( c- g ) occurs very frequently, as in Equation (CD12-3.1), and this grouping is termed  :
:


 the shape factor of catalyst particle, sometimes called the sphericity.
 At the point of minimum fluidization the weight of the bed just equals the pressure drop across the bed:
(CD12-3.4)
 (Re p = g d p U/
 ) we can solve Equation (CD12-3.4) for the minimum fluidization velocity, to give
|
Calculate
|
 deserve comment. The first is , the sphericity, which is a measure of a particle's nonideality in both shape and roughness. It is calculated by visualizing a sphere whose volume is equal to the particle's and dividing the surface area of this sphere by the actually measured surface area of the particle. Since the volume of a spherical particle in
|
Calculate
|

(CD12-3.6)
. It appears in many of the equations describing fluidized-bed characteristics. A correlation exists which apparently gives quite accurate predictions of measured values of (within 10%) when the particles in the fluidized bed are fairly small: 10|
Calculate
|

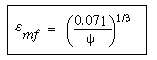
 can be much too small. If a value of below 0.40 is predicted, it should be considered suspect. Kunii and Levenspiel 12 state that is an easily measurable value. However, if it is not convenient to do so, Equation (CD12-3.7) should suffice. Values of around 0.5 are typical. If the distribution of sizes of the particles covers too large a range, the equation will not apply because smaller particles can fill the interstices between larger particles. When a distribution of particle sizes exists, an equation for calculating the mean diameter is
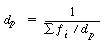
 is the fraction of particles with diameter d pi.
|
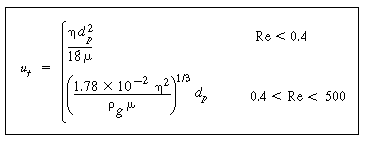
Maximum velocity through the bed ut |
Literally hundreds of investigators have contributed to what is now regarded as a fairly practical description of the behavior of a fluidized bed; chief among these is to be the work of Davidson. 14 Early investigators saw that the fluidized bed had to be treated as a two-phase system: an emulsion phase and a bubble phase (often called the dense and lean phases). The bubbles contain very small amounts of solids. They are not spherical; rather, they have an approximately hemispherical top and a pushed-in bottom. Each bubble of gas has a wake which contains a significant amount of solids. These characteristics are illustrated in Figure CD12-5, which were obtained from x-rays of the wake and emulsion, the darkened portion being the bubble phase.
Davidson found that he could relate the velocity of bubble rise and the cloud thickness to the size of bubble. Kunii and Levenspiel 15 combined these observations with some simplifying assumptions to provide a practical, usable model of fluidized-bed behavior. Their assumptions are presented in Table CD12-3.1. Several of these assumptions had been used by earlier investigators, particularly Davidson and Harrison. 16 With the possible exception of assumption 3, all of these assumptions are of questionable validity, and rather obvious deviations from them are observed routinely. Nevertheless, the deviations apparently do not affect the mechanical or reaction behavior of fluidized beds sufficiently to diminish their usefulness.

Figure CD12-3.3
Schematic of bubble, cloud, and wake.

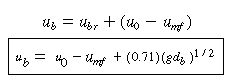
From experiments with single bubbles, Davidson found that the velocity of rise of a single bubble could be related to the bubble size by
| Single bubble |

Other factors that should affect this term are the viscosity of the gas and the size and density of the solid particles that make up the bed. Both of these terms also affect the minimum fluidization velocity, so this term might well appear in any relationship for the velocity of bubble rise; the higher the minimum fluidization velocity, the lower the velocity of the rising bubble.
|
Velocity of bubble rise u b |
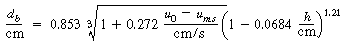
Studies of bubble diameter carried out thus far have concentrated on fluidized beds with no internals and have involved rather small beds. Under these conditions the bubbles grow as they rise through the bed. The best relationship between bubble diameter and height in the column at this writing seems to be that of Mori and Wen, 17 who correlated the data of studies covering bed diameters of 7 to 130 cm, minimum fluidization velocities of 0.5 to 20 cm /s, and solid particle sizes of 0.006 to 0.045 cm. Their principal equation was
| d b |

The maximum bubble diameter, d bm , has been observed to follow the relationship
| d maximum |

| d minimum |
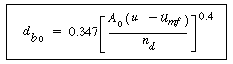
 50%; for beds with diameters between 7 and 30 cm, the accuracy of prediction appears to be approximately +100%, -60% of the observed values.
 Werther developed the following correlation based on a statistical coalescence model: 18
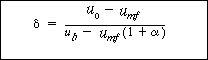
is the fraction of the total bed occupied by the part of the bubbles that does not include the wake, and is the volume of wake per volume of bubble. The bed fraction in the wakes is therefore . The bed fraction in the emulsion phase (which includes the clouds) is (1 - - ). Letting A c and c represent the cross-sectional area of the bed and the density of the solid particles, respectively, a material balance on the solids (Figure CD12-3.4) gives

Figure CD12-3.4
Wake angle  w and wake fraction of three-dimensional bubbles at ambient conditions; evaluated from x-ray photographs by Rowe and Partridge.
Adapted from D. Kuknii and O. Levenspiel,
Fluidization Engineering, 2nd. Ed., (Stoneham, Mass.; Butterworth-Heinemann 1991).
| Velocity of solids u s |

|
Velocity of gas in emulsion u e |
 of the bed occupied by bubbles:
|
Volume fraction bubbles
|
 , is a function of the particle size in Figure CD12-3.4. The value of a has been observed experimentally to vary between 0.25 and 1.0, with typical values close to 0.4. Kunii and Levenspiel assume that Equation (CD12-46) can be simplified to
