Ozone Depletion
Web Module
Anjan K. Chakrabarti
Alejandra De Obeso
Dr. Nihat M. Gürmen
Prof. H. Scott Fogler
![]()
![]()
![]()
1) Open-Ended: Using the principles set forth in the Reaction Pathway and Model sections of this module, develop a numerical model for the catalytic destruction of ozone using another numerical methods solver. Also consider bringing in new ozone reactions, such as those dealing with bromine and NOx (see References).
Applying chemical reaction engineering principles, we use the reaction pathways to develop mole balances per chemical species, coming up with an algebraic expression of reaction rates in which the substance is consumed and/or produced. If the subtance is consumed, its reaction expression will be negative; if the substance is produced, its reaction expression will be positive.
.JPG)
Applying PSSH (Pseudo-Steady-State Hypothesis)
By applying PSSH to this model, you will be considering that the rate coefficient of O, Cl, ClO, Br, and BrO is just too high in comparison to the other reaction rates in the mechanisms, wich means that O, Cl, ClO, Br, and BrO react just as rapidly as they are created. This will further signify that your differential equations for these three substances will equal '0', as if they were part of a steady-state mechanism.
The ultimate goal of applying PSSH is to come up with algebraic expressions that do not depend on the concentrations of these free radicals. In this model, you will be solving a system of equations for O, Cl, ClO, Br, and BrO to be further substituted into the rate expressions of O2, O3, (ClO)2, ClOO, NO, NO2, and BrCl.
The mathematical procedure is detailed to a full extent in Chapter 7 of Dr. Fogler's Elements of Chemical Reaction Engineering. Furthermore, the complete step-by-step solution of the PSSH model is available in .PDF format, in the Downloads section. Only the final equations are shown in the image below:
To download the mathematical procedure directly, click here:
Equations.pdf
.JPG)
Entering the above rate laws, specific reaction rates, mole balances, and initial species concentrations into any differential equations solver will model this system as an imaginary batch reactor 30 km above the Earth’s surface.
WARNING
The differential equations for the system above are very stiff. Most differential equation solving programs will have difficulty with them since the time steps for each reaction vary so greatly. For Polymath, the model with these initial concentrations can only be run for a time period of 7x10⁴ seconds or less before it collapses. As a result, the realistic effects of ozone depletion cannot be examined, but the mechanism of chlorine catalyzed destruction of ozone can be understood and observed. However, if you would like to change the initial conditions of the system, you might find out that the time threshold will be reduced or augmented.
Here is a screen shot of the equations entered into Polymath’s Differential Equation Solver.
Download the original Polymath file of this problem, by clicking here:
Model.pol
This is a display of the report printed by Polymath. Notice the reaction rates, as well as the decrease in ozone concentration, and the final distribution of the free radicals.
Finally, this is a graph produced by Polymath of ozone concentration over the 7x10⁴ second period of time. Notice the non-linear decline caused by the chain reactions set off by chlorine, nitrogen oxides, and bromine. In comparison to the original model in which ozone depletion followed a steady linear decrease, this case exemplifies how different reaction mechanisms can contribute to the rapid consumption of a reactant, which -in the long run- will tend to stabilize and stop the reactions altogether.
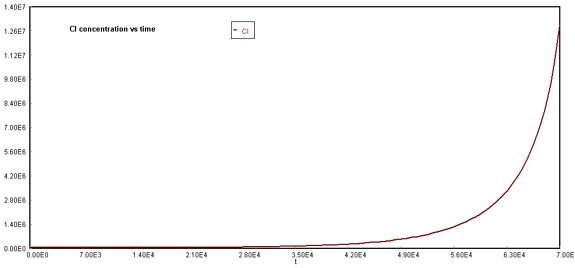
O3 decline due to NOx and CFCsChlorine concentration increased exponentially due to the formation of free radicals that appeared after chlorofluorocarbon breakup. Recall and compare the behavior of chlorine in the original Problem case, where its formation was also non-linear, but its growth pattern was not as steep as the image shown below. This can also be explained with the reaction mechanisms in which bromine participates, increasing the release of chlorine radicals.
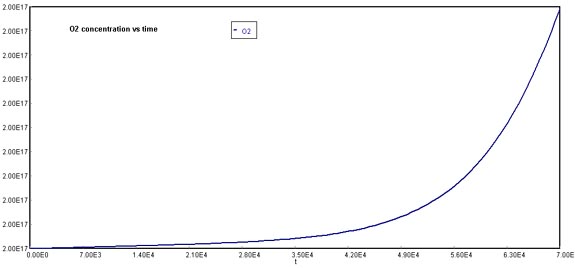
Behavior of Cl through timeA similar situation occurs with oxygen formation, which is not linear in comparison to the original case.
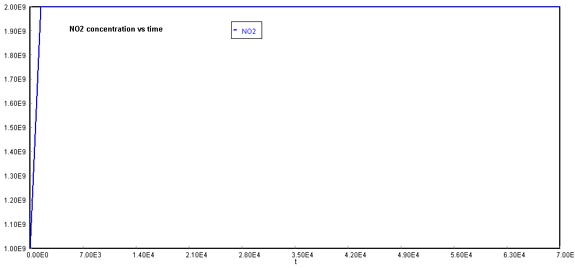
Behavior of O2 through timeFinally, NOx concentration increases dramatically over time. The reason why this graph appears to stabilize at 2E+09 molecules/cm3, is that the actual production rate goes over this quantity. If you were to increase the maximum value of the Y-axis, the pattern of NOx formation would be linear.
Behavior of NOx through timeNote that this model can be changed, varied, and perturbed for different situations. Also, better models can always be developed from other differential equation solvers.
2) Open-Ended: See if you can think of scenarios where this model can be applied. Also, think of situations where this model fails. How can it be adjusted/reworked so that it is applicable to your problem? Creativity is important here.
The model can be applied as long as the conditions of P = 1,000 Pa and T = 300ºK are maintained. Of course, it is important to note that the initial concentrations chosen for those particles that were 'not present' when the reaction started do not represent the real-life conditions of the stratosphere. (In real life, this model has been running for millions of years without stopping).
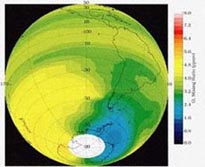
The model will fail if one considers the actual temperature profile of the stratosphere, which varies as we go higher or lower into space. In addition, climatic conditions and wind currents also upset this profile and affect the distribution of molecules in the stratosphere. This is one of the reasons that explains the location of the ozone hole in the Antarctic, instead of the Northern Hemisphere. Some molecules in particular (NO and NO2) react violently to temperature changes, which means that the rate coefficients would not be constant, and that they should be modeled as a function of temperature.
.JPG)
.jpg)
.JPG)
.jpg)