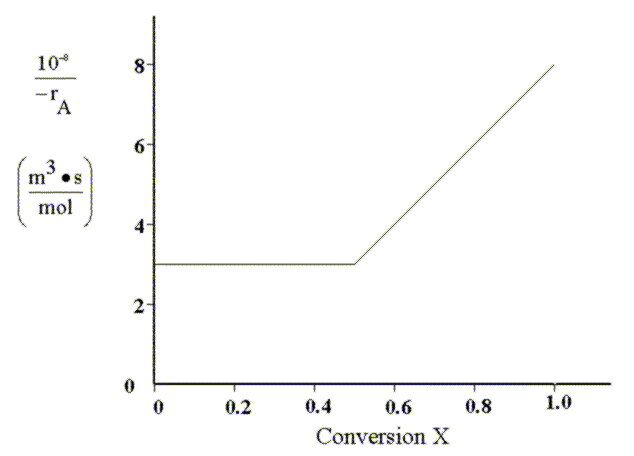
So that it is easier to visualize the solution, we first plot the inverse of the reaction rate versus conversion. This type of plot is often called a "Levenspiel Plot.":
Recalling the mole balance equations for a CSTR and a PFR:

Until the conversion (X) reaches 0.5, the reaction rate is independent of conversion and the reactor volumes will be identical.
i.e.

For now, we will assume that conversion (X) will be less that 0.5. We start with the CSTR mole balance:
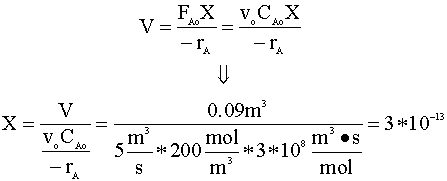
Our calculated conversion is extremely small.
This problem will be divided into two parts, as seen below:
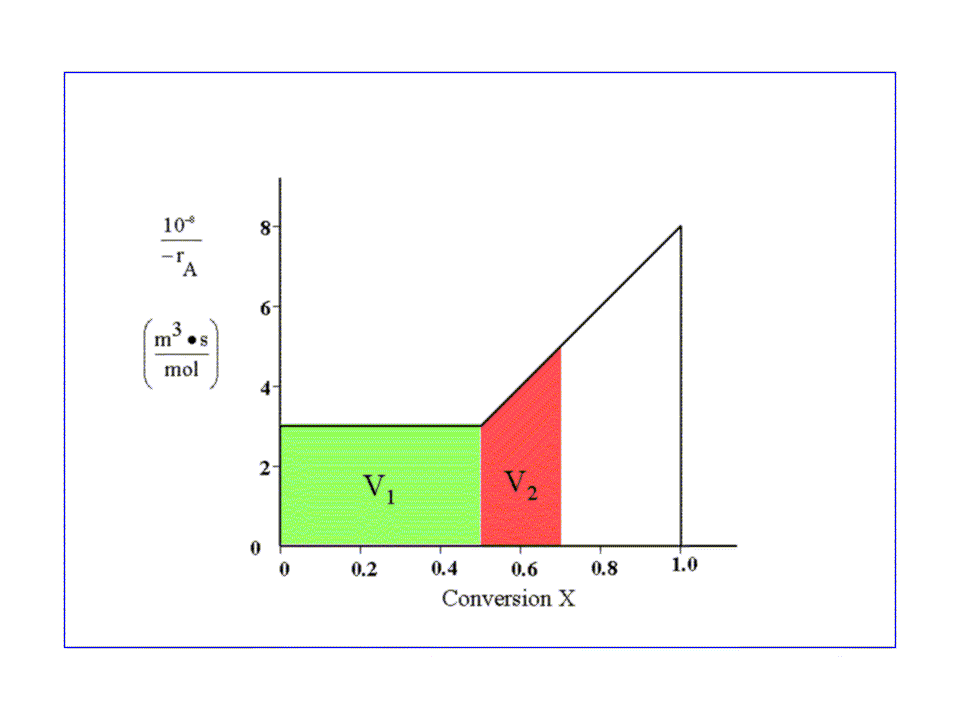
- The PFR volume required in
reaching X=0.5 (reaction rate is independent of
conversion).

- The PFR volume required to go from X=0.5 to X=0.7 (reaction rate depends on conversion).
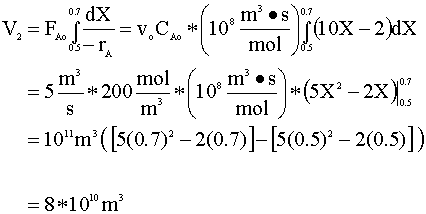
Finally, we add V2 to V1 and get:
Vtot = V1 + V2 = 2.3*1011 m3
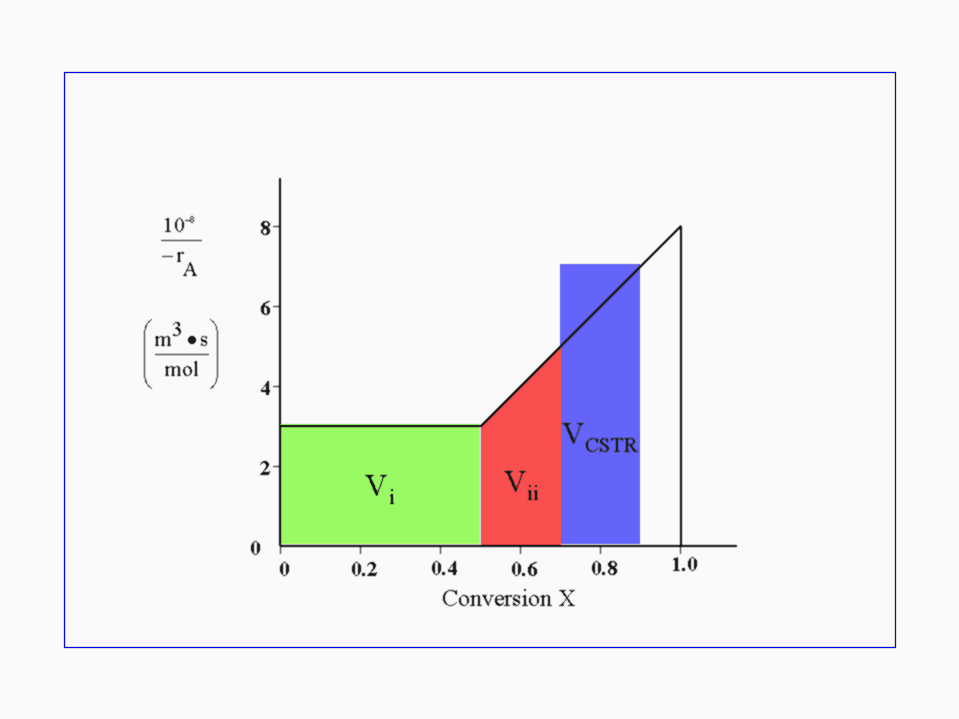
We notice that the new inverse of the reaction rate (1/-rA) is 7*108. We insert this new value into our CSTR mole balance equation:

We will begin with the mole balance on a batch system. Since there is no flow into or out of the system, it can be written as:
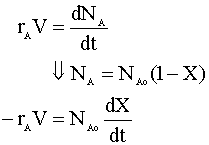
From the stoichiometry of the reaction we know that V = Vo(1+e X) and e is 1. We insert this into our mole balance equation and solve for time (t):
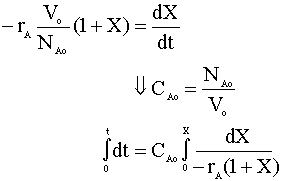
After integration, we have:

Inserting the values for our variables:

That is 640 years.
The following graph plots the reaction rate (-rA) versus the PFR volume:
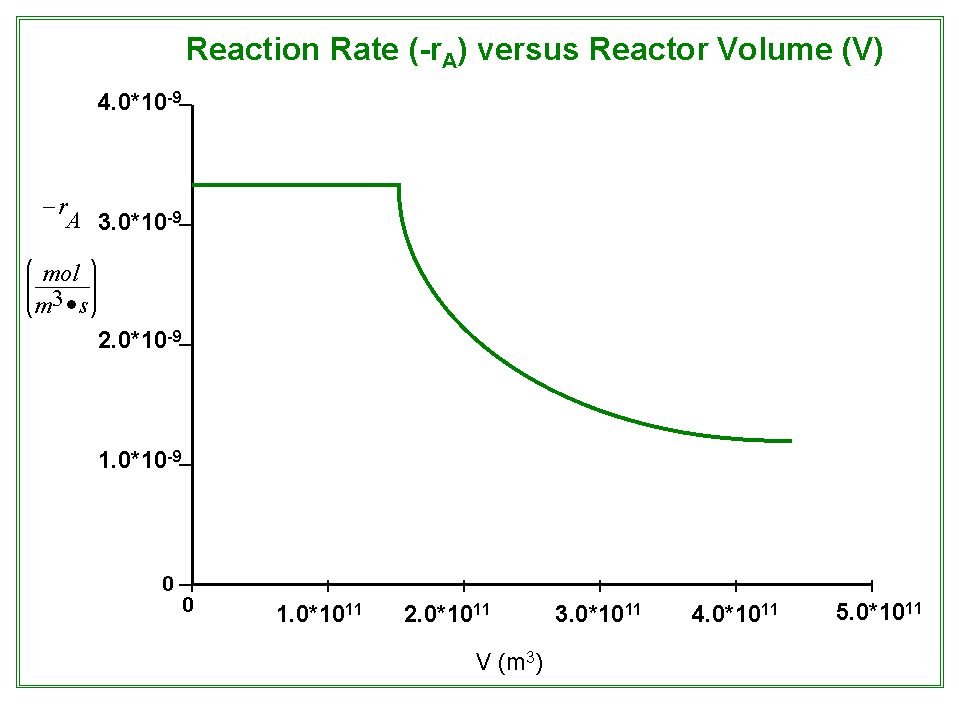
Below is a plot of conversion versus the PFR volume. Notice how the relation is linear until the conversion exceeds 50%.
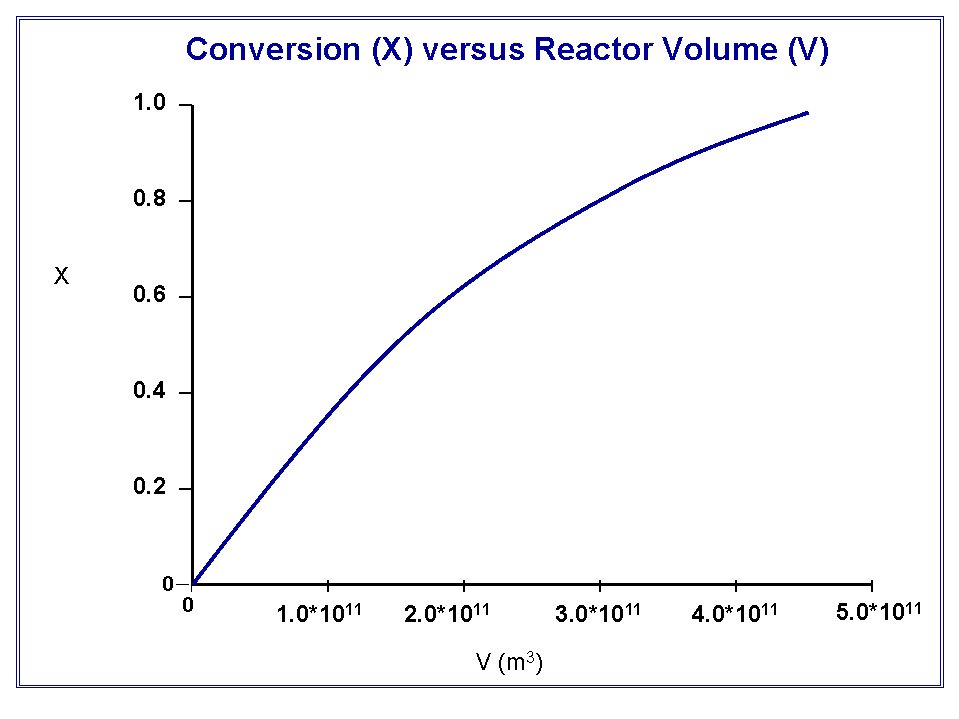
The volume required for 99% conversion exceeds 4*1011 m3.
The rate of reaction for this problem is extremely small, and the flow rate is quite large. To obtain the desired conversion, it would require a reactor of geological proportions (a CSTR or PFR approximately the size of the Los Angeles Basin), or as we saw in the case of the batch reactor, a very long time.