Four to six weeks in the lab can save you an hour in the library--G.J. Quarderer, Dow Chemical Co.
So far, this chapter has presented various methods of analyzing rate
data. It is just as important to know in which circumstances to use each method as
it is to know the mechanics of these methods. In this section we discuss a heuristic
to plan experiments to generate the data necessary for reactor design. However, only
a thumbnail sketch will be presented; for a more thorough discussion the reader is
referred to the books and articles by Box and Hunter.
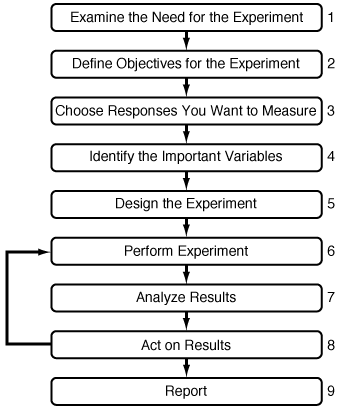
Text Figure 7-12 provides a road map to help plan an experimental program.

When you are preparing to initiate an experimental program, be sure to question yourself and others to help guide your progress. The following questions will help you dig deeper into your project.
These and other appropriate questions must be answered prior to beginning the experimental program so that the need for the experiments is clearly established. Figure 7-12 shows a flow sheet for experimental planning.
Prepare a list of all the things you want to accomplish. Next try to prioritize your list, keeping in mind the following:
Specific answers to these questions will guide the rest of the project.
There are generally two different types of variables that are considered in an experimental program. The independent variables make things happen. Changes in the independent variables cause the system to respond. The responses are the dependent variables. Changing any one of the independent variables will change the system response (the dependent variable). As the experimental program is designed, the important dependent variables to be measured must be identified.
In any experimental program there will always be many, many quantities you can measure. However, you must decide which independent variables have the greatest influence on the dependent variable.
To obtain the maximum benefit from a series of experiments, they must be properly designed. How can the experimental program be designed to achieve the experimental objectives in the simplest manner with the minimum number of measurements and the least expense? A successfully designed experiment is a series of organized trials which enables one to obtain the most experimental information with the least amount of effort. Three important questions to consider when designing experiments are:
There are two types of errors that should be avoided in experimental design. A type I error is one in which you declare that a variable has an effect on the experimental outcome when in fact it really doesn't. A type II error occurs when we fail to discover a real effect. A type II error results in lost information; a variable gets incorrectly classified as insignificant to the process or ignored and as a result, no further examination of it takes place. Type II errors can be avoided by researching fundamental principles related to the experiments, gathering sufficient information, and planning thoughtfully.
The minimum number of experiments that must be performed is related to the number of important independent variables that can affect the experiment and to how precisely we can measure the results of the experiment. One of the most important strategies to remember is to carry out first experiments at the extremes (maximum and minimum setting) of the range of the controlled variables. For example, if the range of pressures that can be used to determine the rate law of a gas-phase reaction is from 1 to 100 atm, it is somewhat best to determine the rate at 1 atm and then at 100 atm. If the independent variables have no effect on the dependent variables at the extremes, it is somewhat doubtful that there will be an effect in the intermediate range. Consequently, a lot of time, money, and energy would be lost if we progressed from a setting of 1 atm to 2 atm and found no effect, then to 10 atm and found no change, then to 50 atm and 80 atm with similar results.
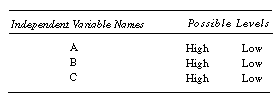
In designing the experiments, we will first choose two levels (i.e., settings) for each independent variable. Because these levels are usually at the extremes of the variable range, we refer to these settings as high and low (e.g., on/off, red/green, 100 psi/14.7 psi, 100°C/0°C, etc.). For example, consider an experimental program where the dependent variable is a function of three independent variables (A, B, and C), each of which can take on two possible values or levels.

If all possible variable combinations were to be tested, the number of experiments
is equal to the number of levels, N, raised to the power of the number
of independent variables, n. For the example for variables A, B, and
C, the number of experiments necessary to test all combinations of independent
variables is equal to![]() experiments.
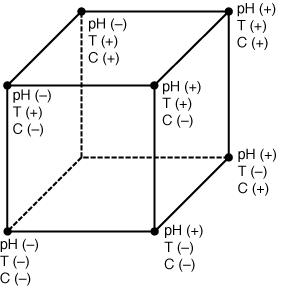
These are detailed in Table A and Figure 7-13 [(+) indicates a high level,
while (-) indicates a low level of a particular variable].
experiments.
These are detailed in Table A and Figure 7-13 [(+) indicates a high level,
while (-) indicates a low level of a particular variable].
TABLE A. CONTROLLED VARIABLE SETTINGS
|
Experiment No. |
pH |
Temperature |
Concentration |
|
1 |
- |
- |
- |
|
2 |
+ |
- |
- |
|
3 |
- |
+ |
- |
|
4 |
- |
- |
+ |
|
5 |
+ |
+ |
+ |
|
6 |
- |
+ |
+ |
|
7 |
+ |
- |
+ |
|
8 |
+ |
+ |
- |
For example, let's design a series of experiments to determine the effect of pH and temperature on the rate of the enzyme-catalyzed decomposition of urea.
![]()
Enzyme degradation is believed to occur at temperatures above 50°C and pH values above 9.5 and below 3.0. The rate of reaction is negligible at temperatures below 6°C. For a urea concentration below 0.001 M, the reaction will not proceed at a measurable rate and the rate appears to be

Figure 7-13
Placement (high/low) of controlled variables.
independent of concentration above 0.1 M. Consequently, the following high/low values of the parameters were chosen:
| A (-) pH 4 | (+) pH 8 |
| B (-) 10°C | (+) 40°C |
| C (-) 0.005 M | (+) 0.1 M |
If there is no interaction among the variables (which may not be known beforehand), experiments 1-4 will yield all the necessary information (Table B). By no interaction it is meant that each of the variables affects the outcome of the experiment independently and there is no synergistic effect of a combined interaction. When there is no interaction, the effect of the pH variable changing from a high value to a low value is always the same, regardless of whether or not the values of temperature and urease concentration are high or low. Experiments 1-4 explore the effect of raising each variable, in turn, from its low level to its high level. In this type of situation, the minimum number of experiments that must be run is the number of independent variables plus one (3 + 1 = 4), and we can predict the results of the other experiments (5 through 8) by combinations of the appropriate responses. However, if there is interaction among the variables, it will not be detected from the tables. For example, if there is interaction between temperature and pH, the higher temperature may cause the pH to have a stronger effect on the reaction than at low temperatures. Then all eight experiments would be required to detect an interaction such as this one.
TABLE B: FIRST FOUR EXPERIMENTS
|
Experiment |
pH |
Temperature |
Concentration |
Comments |
|
1 |
- |
- |
- |
Base case |
|
2 |
+ |
- |
- |
Reveals effect of high pH |
|
3 |
- |
+ |
- |
Reveals effect of high temperature |
|
4 |
- |
- |
+ |
Reveals effect of high concentration |
A full factorial design (all eight experiments in this case) is also useful for developing a model to predict the outcome of experiments whose independent variables can change continuously (i.e., they can assume a continuous range of values and not just two discrete values). Two levels (at least) of each of the variables are examined and the results can be interpreted in the form of a model to predict the outcome of future experiments. Deming5
discusses this method of statistically designing experiments.
If there is some error associated with measuring the outcome of an experiment, we must consider repeating some of the trials to be sure we have accurate information. But how much data is enough? The answer to this question depends on how precise (reproducible) the experiments are and on how small a change in the outcome or result of an experiment we wish to detect. Obviously, the less precise the measurements (i.e., the more error that is present) and the smaller the change we are interested in, the more data we must collect and average to be confident in our result. Averaging several runs under the same conditions is the best way to deal with such a situation to ensure reliable results. The required number of times that each run should be repeated prior to averaging can easily be calculated using a statistical procedure discussed by Hendrix.6
How good are the measurements? What modifications, if any, of the
existing equipment are necessary to improve the accuracy or precision of the measurements
or to better achieve the overall experimental objectives? In the experiments, we
might find that the urease reaction results are inconclusive with respect to pH in
the high-temperature range, and additional runs will be necessary. Is there software
available to perform least-squares analysis (see Appendix A.4), set confidence limits,
or other statistical analyses? Is there any mathematical model or theory available
that suggests how the data might be plotted or correlated? What generalizations can
be made from the data? Should other experiments be run to extend the data into different
regions? Has an error analysis been performed, and sources of error listed and discussed
in relation to how they affect the final result (i.e., by what magnitude and in what
direction?). Finally, have all experimental objectives been satisfied?
Communicate the results of your work with other members of your team. This is usually done by means of a technical report. Guides for writing such a report can be found in many books. One good source is Designing Technical Reports by J. C. Mathes and D. W. Stephenson (Indianapolis, Ind.: Bobb-Merrill, 1976), which has particularly useful examples. Typically, a report will include the following sections:
1. Abstract. This one-page summary of the report is usually written last. It defines the problem, tells how you approached the problem, and states the important results that were found.
2. Introduction. The introduction section defines the problem, tells why it is an important problem worthy of being studied, gives background information, describes the fundamental issues, and discusses and analyzes how they relate to published work in the area.
3. Materials and methods. This section describes the equipment used to carry out the experiments, as well as instruments used to analyze the data. The purity of the raw materials is specified, as are the brand names of each piece of equipment. The accuracy of each measurement taken is discussed. The step-by-step procedure as to how a typical run is carried out is presented, and all sources of error are discussed. (If you developed a new model or theory, a theory section would come after section 3. The theory section would develop the governing equations that mathematically describe your phenomena and justify all assumptions in the development.)
4. Results. This section tells what you found. Make sure that figures and tables all have titles and the units of each variable are displayed. Discuss all sources of error and describe how they would affect your results. Put an error bar on your data where appropriate.
5. Discussion of results. This section tells why the results look the way they do. Discuss whether they are consistent with theory, either one you developed or that of others. You should describe where theory and experiment are in good agreement as well as those conditions where the theory would not apply.
6. Conclusion. The conclusion section lists all important information you learned from this work in numerical order; for example:(a) The reaction is insignificant below 0°C. (b) The results can be described by the Buckley-Leverette Theory.
7. References. List all resource material you referred to in this work in the proper bibliographical format.
In addition to the sections of the technical report described above, many companies require an executive summary, which is usually an expanded version of the abstract that includes the conclusion and recommendations. However, at least of equal importance to the sections that are in the report are the style and clarity with which the report is written. A top ten list of things to look for in an effective report is shown below.
TOP TEN LIST FOR EFFECTIVE WRITTEN REPORTS
In addition to written reports, you will also be expected to give
oral reports throughout your career and you should refer to some of the references
at the end of the chapter to prepare your presentation. The top ten list below identifies
some of the key points to consider.
TOP TEN LIST FOR EFFECTIVE PRESENTATIONS