Polymath Tutorial
Non-linear Regressions
First, open Polymath and click on the Regression button on the toolbar (![]() ). Input your data to be analyzed into the spreadsheet. Now click on the Regression tab on the right side of the window, and select the "Nonlinear" regression tab under the "Report" and "Store Model" check boxes. The window should look like this:
). Input your data to be analyzed into the spreadsheet. Now click on the Regression tab on the right side of the window, and select the "Nonlinear" regression tab under the "Report" and "Store Model" check boxes. The window should look like this:
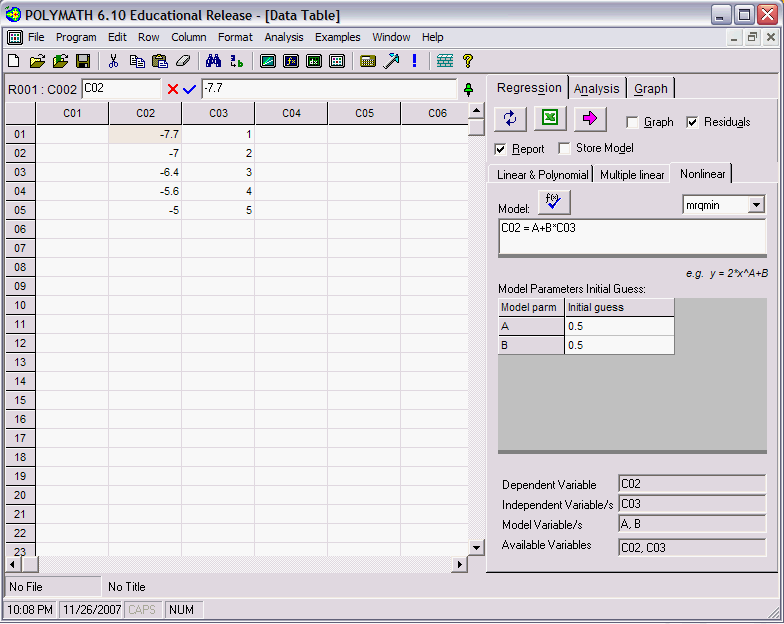
Now input the model form you wish your equation to match. In this case, The form is C02=A+B*C03, where C02 and C03 are columns in the data table that we are using. Next we need to select an appropriate regression analysis routine. In this case we have chosen "mrqmin". Next, input initial guesses for the parameters in your model, in this case, A and B. (Note: The solution Polymath provides may be very sensitive to the initial value guesses, so if the first regression solution is not very good, you may want to change the initial guesses and rerun the regression.) Now select what you want polymath to output by checking the boxes on the right side of the window. Click on the pink arrow to have Polymath perform the regression.
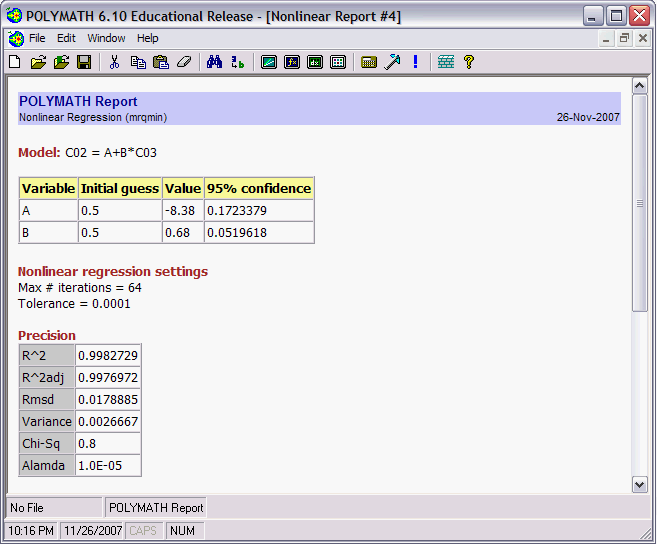
If you selected "Report" you will see a screen like this that details the results from the regression analysis.
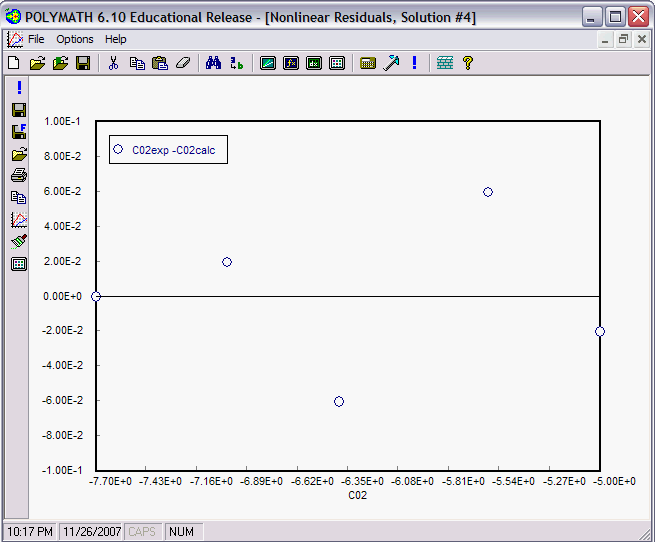
If you selected residuals, then you will get a residuals plot that looks like this.
If you selected Graph, you will get a graph of your results that looks like this.
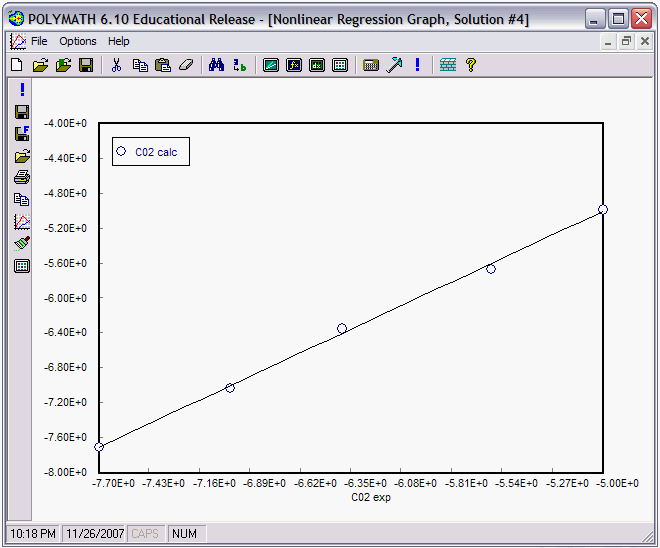
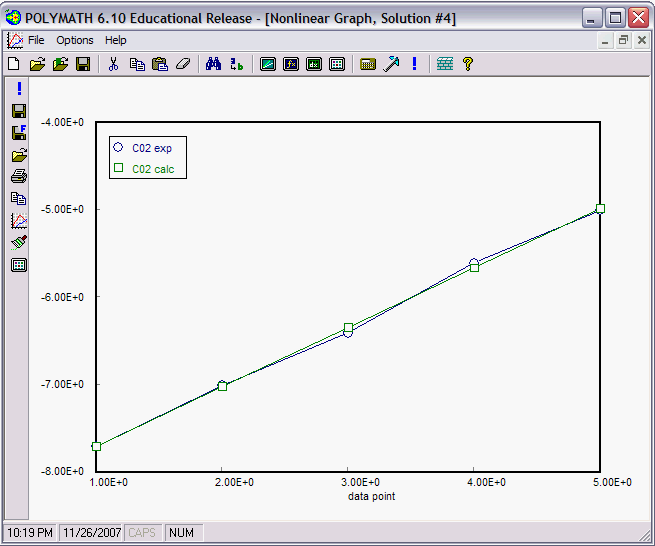
If you checked the box "Store Model", then a graph of the experimental and calculated data sets are graphed together for comparison.
