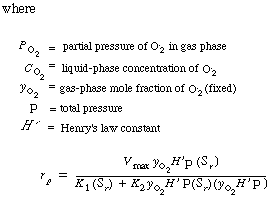
|
|
|
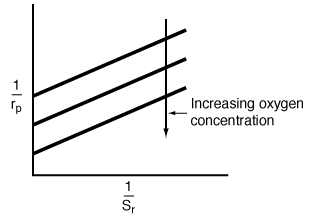
Construct a Lineweaver-Burk plot for this system in which each line corresponds
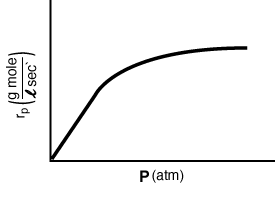
to a different oxygen concentration. Also discuss the effect of total gas
pressure of fixed oxygen concentration on the rate of this liquid-phase
reaction,rp. (Hint: Recall
Henry's law.) |
|
|
|
|
|
|
|
|
|
Solution
We first invert Equation (R7.4-7) to find |
|
|
|
|
|
|
|
|
|

|
(RE7.4-1.1) |
|
|
|
|
|
|
|
|
From Equation (CD7-6.1) we see that changes in the oxygen
concentration will only affect the intercept of a Lineweaver-Burk plot.
As the oxygen concentration increases, the intercept decreases.
Assuming equilibrium between oxygen in the gas phase and oxygen in the liquid
phase, we obtain the following relationship (Henry's law): |
|
|
|
|
|
|
|
|
|

|
|
|
|
|

|
(RE7.4-1.2)
|
|
|
|
At high pressures, |
|
|
|
|
|
|
|
|
|

|
|
|
|
|
|
|
|
|
|
At low pressures, |
|
|
|
|
|
|
|
|
|

|
|
|
|
|
|
|
|
|
|
Figure RE7.4-1.1 shows the a Lineweaver-Burk plot for various
oxygen concentrations, and Figure RE7.4-1.2 shows the reaction rate as a
function of total pressure for a fixed mole fraction of oxygen. |
|
|
|
|
|
|
|
|
|

Figure RE7.4-1.1

Figure RE7.4-1.2
|
|
|
|
|
|
|
![]()
![]()

![]()
![]()

