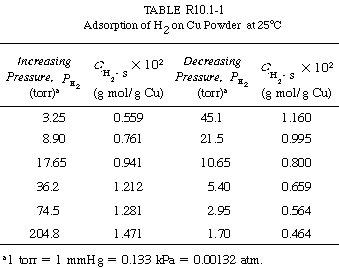
Consider the adsorption of a non-reacting gas onto the surface of a catalyst. Adsorption data are frequently reported in the form of adsorption isotherms. Isotherms portray the amount of a gas adsorbed on a solid at different pressures but at one temperature. A typical adsorption isotherm, shown in Figure R10.1-1, is taken from the classic study of Ward, 1 who adsorbed hydrogen on powdered copper at 25°C (see Table R10.1-1). The data appear to be quite precise. Only one point is slightly off a smooth curve, and there is no hysteresis because the points taken while the pressure was being gradually increased lie on the same curve as those taken while the pressure was decreased.
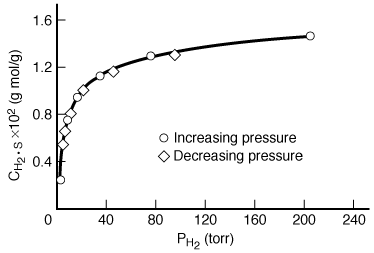
Figure R10.1-1
Adsorption of hydrogen on copper
Postulate models, then see which one(s) fit(s) the data
This isotherm can be used to gain insight into the adsorption process. An equation for the curve in Figure R10.1-1 will be derived, and the derivation will reveal significant properties of the hydrogen-copper system. First, a model system is proposed and then the isotherm obtained from the model is compared with the experimental data shown on the curve. If the curve predicted by the model agrees with the experimental curve, the model may reasonably describe what is occurring physically in the real system. If the predicted curve does not agree with that obtained experimentally, the model fails to match the physical situation in at least one important characteristic, and perhaps more. To describe Ward's data, two models will be postulated--one in which hydrogen is adsorbed as molecules, H 2 , on copper powder, and the other in which hydrogen is adsorbed as atoms, H, instead of molecules.
Two models:
1. Adsorption as H 2
2. Adsorption as H
The former is called molecular or nondissociated (e.g., H 2 ) adsorption and the latter is called dissociative adsorption. Whether a molecule adsorbs nondissociatively or dissociatively depends on the metal (M) surface. For example, CO undergoes dissociative adsorption on iron and molecular adsorption on nickel.

A. Molecular Adsorption
The adsorption of hydrogen molecules will be considered first. Since
the hydrogen does not react further after being adsorbed, we need only to consider
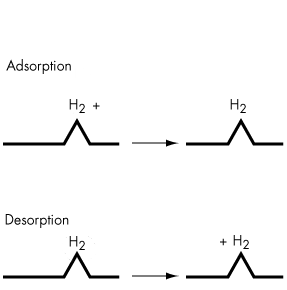
the adsorption process:
(R10.1-1)
In obtaining a rate law for the rate of adsorption, the reaction in
Equation (R10.1-1) can be treated as an elementary reaction. The rate of
attachment of the hydrogen molecules to the surface is proportional to the number of
collisions that these molecules make with the surface per second. In other words, a
specific fraction of the molecules that strike the surface become adsorbed. The
collision rate is, in turn, directly proportional to the hydrogen partial pressure,![]() .
Because hydrogen molecules can adsorb only on vacant sites and not on sites already
occupied by other hydrogen molecules, the rate of attachment is also directly
proportional to the concentration of vacant sites,
C
.
Because hydrogen molecules can adsorb only on vacant sites and not on sites already
occupied by other hydrogen molecules, the rate of attachment is also directly
proportional to the concentration of vacant sites,
C![]() . Combining these two facts means
that the rate of attachment of hydrogen molecules to the surface is directly proportional to the product of the partial pressure of H and
the concentration of vacant sites:
. Combining these two facts means
that the rate of attachment of hydrogen molecules to the surface is directly proportional to the product of the partial pressure of H and
the concentration of vacant sites:
rate of attachment![]()
The rate of detachment of molecules from the surface can be a
first-order process; that is, the detachment of hydrogen molecules from the surface
is usually directly proportional to the concentration of sites occupied by the
molecules,![]()
rate of detachment![]()
The net rate of adsorption is equal to the rate of molecular attachment to the surface minus the rate of detachment from the surface. If k A and k -A are the constants of proportionality for the attachment and detachment processes, then
(R10.1-2)

( The ratio K A = k A / k - A is the adsorption equilibrium constant. Using it to rearrange Equation (R10.1-2) gives

(R10.1-3)
The parameters k A , k -A , and K A are all functions of temperature, exhibiting an exponential temperature dependence. The forward and reverse specific reaction rates, k A and k -A increase with increasing temperature, while the adsorption equilibrium constant, K A , decreases with increasing temperature. At a single temperature, in this case 25°C, they are, of course, constant in the absence of any catalyst deactivation.
Because hydrogen is the only material adsorbed on the catalyst, the site balance gives
(R10.1-4)
The points plotted in Figure R10.1-1 were taken at equilibrium conditions. The experimental details present in the original work support this fact, and the absence of hysteresis confirms it. At equilibrium, the net rate of adsorption equals zero. Setting the right-hand side of Equation (R10.1-3) equal to zero and solving for the concentration of H 2 adsorbed on the surface, we get
(R10.1-5)
Using Equation (R10.1-4) to give C![]() in terms of
in terms of![]() and
the total number of sites Ct we can solve for
and
the total number of sites Ct we can solve for![]() in
terms of constants and the pressure of hydrogen:
in
terms of constants and the pressure of hydrogen:
Rearranging gives us

(R10.1-6)
Langmuir isotherm for adsorption of molecular hydrogen
This equation thus gives![]() as a function of
the partial pressure of hydrogen, and so is an equation for the adsorption isotherm.
This particular type of isotherm equation is called a Langmuir isotherm.
2
as a function of
the partial pressure of hydrogen, and so is an equation for the adsorption isotherm.
This particular type of isotherm equation is called a Langmuir isotherm.
2
A quick look shows that this equation shares many properties with the
curve in Figure R10.1-1. As was shown in Chapter 5, one method of checking whether a
model predicts the behavior of some experimental data is to linearize the model's
equation and then plot the indicated variables against one another. For example,
Equation (R10.1-6) may be arranged in the form

(R10.1-7)
and the linearity of a plot of![]() as a function of
as a function of![]() will determine if the data conform to a Langmuir single-site isotherm. The data in
Figure R10.1-1 are replotted in Figure R10.1-2 in the form suggested by Equation (R10.1-7).
The data indicate a slight but definite curvature. Thus there is a significant question
as to whether these data really conform to a model of hydrogen adsorbing as molecules.
will determine if the data conform to a Langmuir single-site isotherm. The data in
Figure R10.1-1 are replotted in Figure R10.1-2 in the form suggested by Equation (R10.1-7).
The data indicate a slight but definite curvature. Thus there is a significant question
as to whether these data really conform to a model of hydrogen adsorbing as molecules.
B. Dissociative Adsorption
Next, the isotherm for hydrogen adsorbing as atoms is
derived:
When the hydrogen molecule dissociates upon adsorption, it is referred
to as the dissociative adsorption of hydrogen. As in the case of molecular
adsorption, the rate of adsorption here is proportional to the pressure of hydrogen
in the system, because this rate governs the number of gaseous collisions with the
surface. For a molecule to dissociate as it adsorbs, however, two adjacent vacant
active sites are required rather than the single site needed when a substance adsorbs
in its molecular form. The probability of two vacant sites occurring adjacent to one
another is proportional to the square of the concentration of vacant sites. These two
observations mean that the rate of adsorption is proportional to the product of the
hydrogen partial pressure and the square of the vacant site concentration,![]() .
.
For desorption to occur, two occupied sites must be adjacent, meaning
that the rate of desorption is proportional to the square of the occupied-site
concentration,
(![]() )2.
The net rate of adsorption can then be expressed as
)2.
The net rate of adsorption can then be expressed as
(R10.10-8)
On this particular
catalyst the
data show that
hydrogen does not
adsorb as molecules
(H 2 )
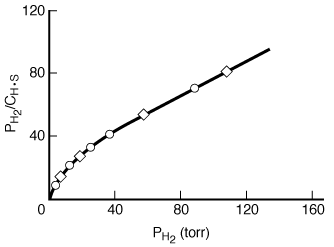
Figure R10.1-2
Adsorption of molecular hydrogen
Factoring out
k A , the equation for
dissociative adsorption is
Rate of
dissociative
adsorption

where
At equilibrium, r AD = 0, and
or
(R10.1-9)
From Equation (R10.1-1),
This value may be substituted into Equation (R10.1-9) to give an
expression that can be solved for![]() .
The resulting isotherm equation is
.
The resulting isotherm equation is
Langmuir isotherm for adsorption as atomic hydrogen

(R10.1-10)
Taking the inverse of both sides of the equation, and then multiplying
through by![]() , yields
, yields

(R10.1-11)
This equation is the linearized Langmuir isotherm for dissociative
adsorption. It says that if the hydrogen is dissociatively adsorbed on the copper,
a straight line should result when![]() is plotted as a function of
is plotted as a function of![]() .
.
The dissociative
adsorption
of H 2 model
fits the
experimental data
for this catalyst.
The data in Figure R10.1-1 are replotted in Figure R10.1-3 in the form suggested by Equation (R10.1-11). An excellent straight line is obtained, giving support to the postulate of hydrogen being dissociatively adsorbed on the copper powder. A comparison of the results of the models indicates that hydrogen is adsorbed on the copper as atoms rather than as molecules. Hydrogen-deuterium tracer studies have confirmed this interpretation. Some comments seem deserved here. The data presented seemed very precise. If they had not been so, and there had been significant scatter, it would have been impossible to distinguish between the two models. The curvature in Figure R10.1-2 is slight, so the difference between the two plots is somewhat subtle. A discerning eye is necessary to distinguish between the two mechanisms in this situation. This subtle difference is one reason why this type of agreement between a model and the behavior of experimental data usually requires supporting spectroscopic and tracer experiments.
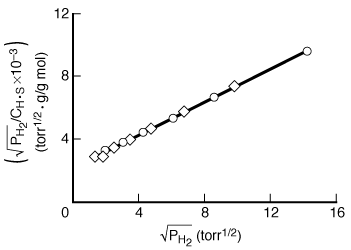
Figure R10.1-3
Dissociative adsorption of hydrogen.