Additional Homework Problems

CDP12-ID

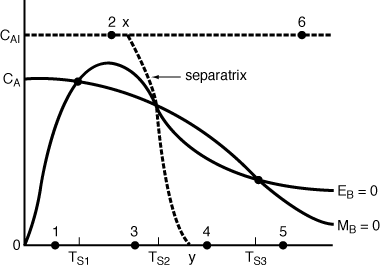
  The concentration-temperature curves for steady energy and mole balances are shown in Figure CDP12-I for a particular reaction. Sketch the various approaches to steady state starting at the different initial conditions shown for points 1 through 6. (Hint: See Figure 7.18, R. Aris, Elementary Reactor Analysis (Upper Saddle River, N.J.: Prentice Hall, 1969).]


Figure CDP12-I

     
    Next consider a first-order irreversible exothermic liquid-phase reactioncarried out in an adiabatic CSTR. The following data are given:


IMAGE 08eq27.gif


The following questions concern variation in one parameter with the others fixed at the values given.

(a) At what space-times do ignition and extinction (blowout) occur?
(b) At what feed concentrations do ignition and extinction occur?
(c) At what feed temperatures do ignition and extinction occur? For the parameter values given:
(d) Plot the curves F = 0 and G =0 in the phase space (CA , T ).
(e) Identify stable and unstable operating points, and corresponding values of C A and T.
(f) Calculate the location of the separatrix.
(g) Plot the phase and time trajectories for the following initial conditions:


IMAGE 08eq28.gif

     
    (R. L. Curl, University of Michigan)

[2nd Ed. P8-22]