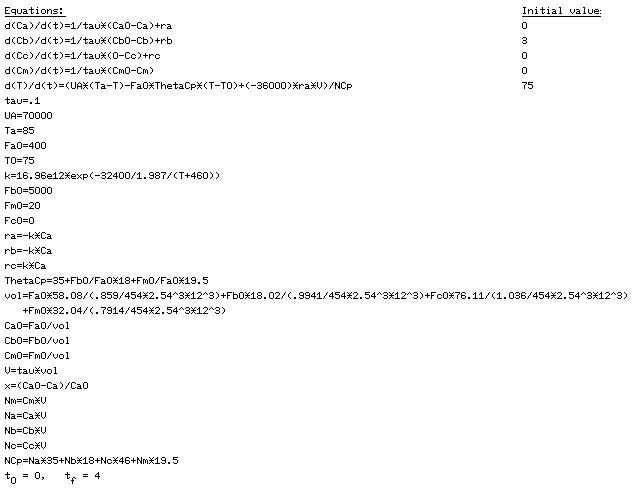
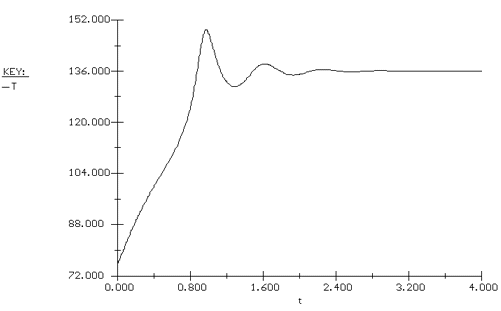
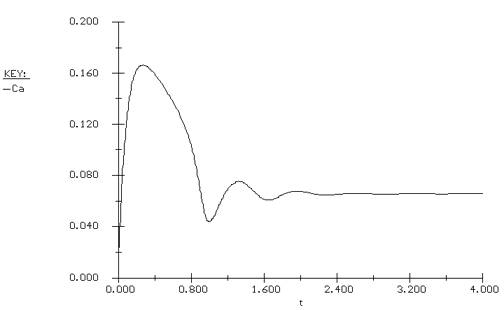
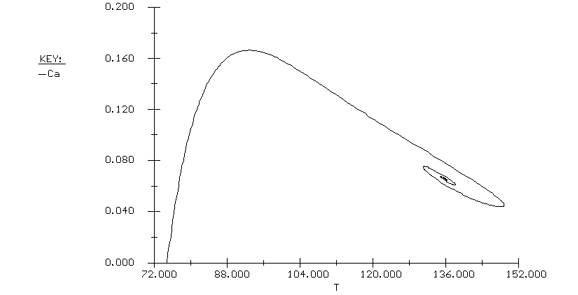
Again we consider the production of propylene glycol (C) in a CSTR with a heat exchanger. Initially there is only water at 75°F and 0.1 wt % H2SO4 in the 1420-gallon reactor. The feed stream consists of 400 lb mol/h of propylene oxide (A), 5000 lb mol/h of water (B) containing 0.1 wt % H2SO4 ,and 20 lb mol /h of methanol (M). Plot the temperature and concentration of propylene oxide as a function of time, and a concentration vs. temperature graph for different entering temperatures.
Solution
![]()
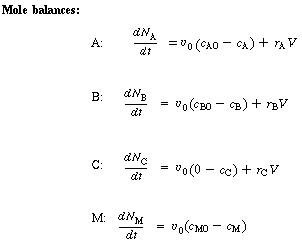
(CDE13-2.1)
(CDE13-2.2)
(CDE13-2.3)
(CDE13-2.4)
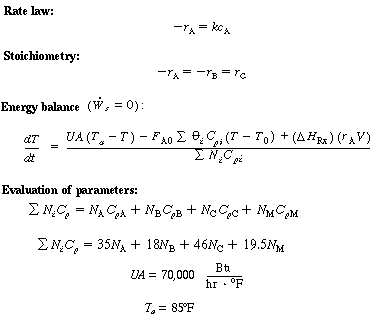
(CDE13-2.5)
(CDE13-2.6)
(CDE13-2.7)
(CDE13-2.8)
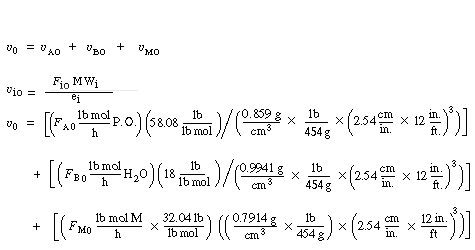
(CDE13-2.9)

(CDE13-2.10)
Neglecting![]() because
it changes the heat of reaction insignificantly over the temperature range
of the reaction, the heat of reaction is assumed constant at
because
it changes the heat of reaction insignificantly over the temperature range
of the reaction, the heat of reaction is assumed constant at

