![]()
Strength of The PROCERA®
ALLCERAM BRIDGE
Brien R. Lang, DDS, MS
Rui-Feng Wang, BS
Byungsik Kang, PhD
Lisa A. Lang, DDS, MS
Michael E. Razzoog, DDS, MS, MPH
Brien R. Lang, DDS, MS
Rui-Feng Wang, BS
Michael E. Razzoog, DDS, MS, MPH
![]() Center
For Excellence Department of Biologic and Materials Sciences
Center
For Excellence Department of Biologic and Materials Sciences
![]() Division
of Prosthodontics
Division
of Prosthodontics
![]() School
of Dentistry
School
of Dentistry
![]() The
University of Michigan, Ann Arbor, MI
The
University of Michigan, Ann Arbor, MI
Byungsik Kang, PhD
![]() Hoff
& Associates
Hoff
& Associates
![]() Ann
Arbor, MI
Ann
Arbor, MI
Lisa A. Lang, DDS, MS
![]() Department
of Prosthodontics School of Dentistry
Department
of Prosthodontics School of Dentistry
![]() University
of North Carolina
University
of North Carolina
![]() Chapel Hill, NC
Chapel Hill, NC
November 29, 2001
INTRODUCTION
The Procera® AllCeram crown developed by Dr. Matts Andersson (Nobel Biocare, AB, Göteborg, Sweden) and Agneta Odén (Procera Sandvik, AD, Stockholm, Sweden) has enjoyed tremendous success throughout the world as an all-ceramic single unit restoration that is both beautiful and strong.1-4 Procera AllCeram crowns have been used in every location in the dental arches and this system of crown fabrication has become an unparalleled standard of care for the all-ceramic single tooth restoration in dentistry. This achievement did not happen by chance, but occurred because of a well-structured research and development program.
The Procera system began with a vision and Dr. Andersson and his co-workers dedicated considerable time and effort in research and development before the system was established as a treatment modality with predictable success. Nobel Biocare has now expanded its vision for the Procera system to include an all-ceramic multiple unit fixed partial denture as illustrated in Fig. 1.
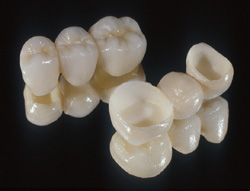
Fig. 1. The Procera AllCeram 3-Unit Bridge.
The Procera AllCeram bridge combines Procera AllCeram crowns with an all-ceramic pontic. The aluminum oxide copings of the crowns are joined to an aluminum oxide pontic substructure using specially formulated Procera Connecting and Fusing materials as illustrated in Fig. 2.
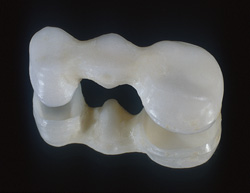
Fig. 2. The Procera AllCeram Aluminum Oxide Assembled Substructure.
The entire three-units of the bridge are then covered with Procera AllCeram veneering porcelain to complete the anatomic form of the bridge and satisfy the esthetics and occlusal requirements of the restoration.
The strength of all-ceramic fixed bridges, so that they can be used in all locations in both dental arches, has traditionally been the limitation for such restorations. Therefore, researchers at the Nobel Biocare/University of Michigan Center for Excellence initiated a multifaceted scientific evaluation combining load to fracture mechanical testing with the finite element method to examined the strength of the Procera AllCeram 3-unit bridge. This report presents the results of a multifaceted scientific evaluation.
MATERIALS AND METHODS
Mechanical Testing of Procera Bridge
Five Procera AllCeram bridges were provided to the Center from Nobel
Biocare. All five bridges were similar in design and dimensions, having
been fabricated from a master set of dies and model. In addition to the
bridges, special dies were obtained from Nobel Biocare that were machined
from a resin material with properties similar to human dentin (Fig. 3).
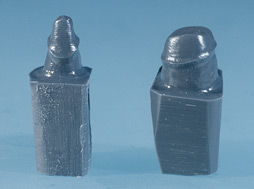
Fig. 3. The Dies Simulating Human Dentin.
The dies were initially evaluated for precision of fit with the Procera AllCeram bridges. An acceptable precision of fit was observed between all of the dies and the individual abutments in the five bridge assemblies. For each bridge, dies were positioned within their respective crowns and secured with sticky wax. A small diameter metal rod was then position in the center of the pontic and perpendicular to the occlusal plane. The rod was attached with sticky wax. The rod, bridge, and dies assembly was then positioned in a dental surveyor. A mixture of improved dental stone was prepared and placed within a base former that was positioned on the base of the surveyor beneath the bridge and dies assembly. The vertical support of the surveyor was then lowered with the rod and bridge assembly into the dental stone up to a level just below the die/crown finish lines. The stone was allowed to harden. The bridge and stone cast was retrieved, and cleansed of all wax and debris. Stone casts were created for all five bridges using this technique. Each Procera AllCaram bridge was then cemented onto the dies using a resin modified glass reinforced ionomer cement (Fuji Plus) under a constant load. After ten minutes, the cemented bridges and their respective stone casts were stored in an environment similar to oral conditions for five days.
The load bearing capacity of the five bridges was examined using the Universal Instron testing machine. Each bridge was positioned in a specially designed holder that was placed in the Instron machine. The Instron loading rod with a tip 2.0 mms in radius was positioned in the center of the occlusal surface of the pontic (Fig. 4).
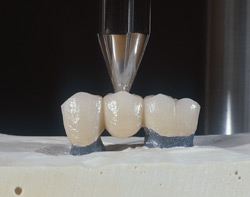
Fig. 4. The Bridges in the Special Holder in the Instron Machine for Testing.
A load was applied by the Instron testing machine to each bridge until fracture and the load was recorded in Newtons (N). The mean load to fracture of the Procera AllCeram Bridge was 697 ± 102 N. During loading, the first signs of fracture occurred along the lower border of the joint area in the Procera AllCeram porcelain. A total fracture of the joint involving the Procera Connection/Fusing material followed the initial failure (Fig. 5).
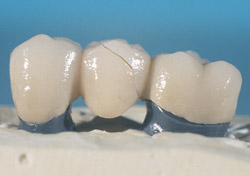
Fig. 5. Fracture Was Initiated in the Lower Joint Area.
Microscopic examination of the fracture site revealed joint material on both sides of the fracture zone (Fig. 6). Once the joint had failed the fracture line continued laterally from the top of the joint across the occlusal surface of the pontic.
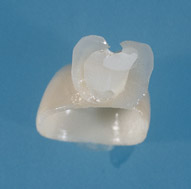
Fig. 6. Joint Material Was Found On Both Sides of the Fracture Area.
Finite Element Analysis Methodology - HyperWorks®
and ABAQUS®
Dental professionals are often inclined to look favorably
on results from physical testing even when their is variability, difficulty
in controlling the testing conditions, and a questioned reliability
of the test results as being indicative of the clinical environment.
Finite element analysis has been suggested as another method that can
lend credibility to the physical test results when correlation can be
demonstrated.
Finite element analysis is a numerical method for solving a system of governing equations over the domain of a continuous physical system such as a beam, or a dental bridge. Small parts called elements subdivide the structure being analyzed. These elements are assembled through interconnection at a finite number of points on each element called nodes. This assembly of the nodes and elements in this manner creates the finite element model of the structure being evaluated. By subdividing the structure in this manner, one can formulate equations for each separate finite element, which are then combined to obtain the solution of the whole physical system.
There are three stages that describe the use of any existing finite element program. The preprocessing stage creates the model of the structure being evaluated from inputs provided by the investigators. A preprocessor then assembles the data into a format suitable for execution by the processor in the next stage. The processor is the computer code that generates and solves the system equations. The third stage is postprocessing. The postprocessor accepts the number solution, presents selected data, and produces graphic displays of the data that are easier to understand and evaluate.
The Preprocessor Stage. The specific design of the abutments, pontic and overall Procera Bridge are illustrated in Figs 7 and 8.
Fig. 7. The Finite Element Model of the Dies (Teeth), Cement Space, And Luting Space.
Fig. 8. The Finite Element Models of the Coping and Pontic.
The design geometry was selected based on measurements of dental casts of patients missing a posterior tooth and restored with a three-unit fixed partial denture. Dies representing the abutment teeth (molars) were modeled with a chamfer finish line and an 8-10 degree axial wall taper. The dies were circular in design and dimensioned similar to what one would achieve preparing a maxillary molar. A cement space between the die surfaces and the inner surface of the abutment copings was also modeled. The cement space was a uniform thickness of 0.060 mms. The terminal abutments were 12.0 mms in diameter positioned on either side of the pontic. The coping was designed with a uniform thickness of 0.600 mms. The pontic was designed with a width of 6.0 mms and a height of 6.0 mms. The length at the inferior border of the pontic was 6.0 mms and the superior border was 10.5 mms.
The junction between the abutment copings and the pontic was configured with a specific design for the Procera Connecting/Fusing material. A projection extended from both ends of the pontic was triangular in shape when viewed facial/lingually. The lower border of the projection was 3.25 mms from the center of the pontic and converged superiorly to a length of 5.25 mms from the center of the pontic. The slope of the projection formed an angle of approximately 25 degrees with the vertical wall of the pontic. The height of the projection from its lower border to the superior surface was 4.0 mms, while the width of the projection when viewed from the top surface was 3.0 mms. Thus the area formed by the projection when viewed proximally was 12.0 mms2. The dimensions of the proximal ends of the coping substructure were exactly the same as the two projections on the proximal surfaces of the copings. The space designed between the coping and the pontic in the joint area was 0.050 mms.
The finite element models for the Procera AllCeram Bridge were created using the software program HyperWorks®. The dies representing teeth in Fig. 7 were allowed to move slightly at their base to simulate a not-so-firm relationship in the jawbone. To achieve this function “spring” finite elements with a stiffness = 2 (N/mm) were designed at the interface between the base nodes of the dies (teeth) and their supporting constraints. The contact interfaces for the material in the cement space was different depending on the cement used in the experiment. In an earlier finite element study on the load to fracture of a single Procera crown it was determined that the finite element contacts between the tooth/cement and cement/coping required “spring” elements to validate the mechanical test data (Wang et al. “Finite element analysis determining bond strength and mode of failure of three luting agents used with Procera® crowns”, IADR/AADR, Abstract #10683, 2002). When the crowns were cemented onto the dies with zinc phosphate as compared to a resin modified glass reinforced ionomer cement (Fuji Plus), or a resin cement (Panavia 21) the magnitude of the springs differed for the cements and for the particular interface (tooth/cement versus cement/coping). The amount of spring required was dependent on the rigidity of the cement. For example, zinc phosphate demonstrated a more rigid (lacked springiness) relationship between the cement and the coping as compared to Fuji Plus and Panavia 21 which were more resilient (springy). Different levels of “spring” elements were also necessary between the cement and the tooth (die). The remaining contact interfaces were modeled as type ‘Node to Surface’ at the interfaces between the copings and pontic at the joint. A prescribed load was positioned in the center of the pontic and the magnitude of the load applied to the model was established as 3000 Newton.
The Processor Stage. The software used for the finite element analyses was ABAQUS Standard 3D 6.2 software. Metric units were used throughout the analyses. Consistent units in the finite element analysis are N, (force), mm (length) and MPa, (stress). The models as illustrated in Fig. 8 was used in three separate FEA experiments to determine the load to fracture when the bridge was cement with three different cementing agents: Zinc Phosphate, Fuji Plus, and Panavia 21. Under each of the cementing conditions the model was evaluated to determine the influence that a 3000 N load applied in the center of the pontic had on the overall structure response (Fig. 9).
Fig. 9. A Finite Element Model Demonstrating the Cement Space in Blue Covering The Dies (Teeth) in Yellow. The Joint Area in Green and the Aluminum Oxide Substructure is Transparent and Overlays the Cement Space.
The Procera AllCeram Bridge is a unique dental structure that combines different materials within one structure. The materials are dentin (the die), cementing agent (cement space), aluminum oxide (the coping and pontic), and the Connecting/Fusing material (joint area).
The physical properties of the specific materials used in each of the three experiments during the processor stage are:
|
Human Dentin Cementing Agents – Zinc Phosphate Cementing Agents – Fuji Plus Cementing Agents – Panavia 21 Aluminum Oxide Procera AllCeram Connecting/Fusing Material
|
|
The Postprocessor Stage. In the processing phase of the FEA, the 3000 N load was applied in twenty (20) increments or until a 3000 N load was reached. The stresses within the various elements of the bridge and the distribution of the stresses over the bridge structure can then be analyzed.
RESULTS
The design of the finite element models provided investigators with the opportunity to examine the response of the Procera AllCeram Bridge to the 3000 N load application. The elements within the materials used for cementation, coping fabrication and connecting/fusing the coping to the pontic provided information about the displacement and stress patterns experienced by these materials and the overall strength of the bridge.
Displacement and Stress Patterns.
To demonstrate the
validity of the FEM simulation of the bridge and its correlation with
mechanical test data, it is necessary to examine both the displacement
patterns and the stress patterns of the bridge models. The bridge model
is in reality a three-point bending test model. The bridge model is held
at both ends at the base of the dies (teeth) and the load is applied in
the center/middle upper surface of the bridge pontic (Fig. 9).
The displacement in a three-point bending test model is usually generated at the model’s middle region along the loading direction with a lateral displacement pattern at the outer end of the model. The typical displacement pattern seen in a three-point bending test model was clearly demonstrated in this finite element bridge model when the experiment was conducted with Zinc Phosphate as the cementing agent (Fig 10).
Fig. 10. Displacement of the Bridge When Cemented With Zinc Phosphate Cement.
In the bridge models that were cemented with Panavia 21 or Fuji Plus, the models were displaced uniformly (Fig. 11).
Fig. 11. Displacement of the Bridge When Cemented With Fuji Plus Cement.
The middle region displacement of the bridge and the displacement between the copings and the dies (teeth) at the ends of the model were uniformly displaced in the Z-axis direction resulting in the bridge being displaced almost parallel to the ZY-plane. The differences in the displacement patterns when the bridge was cemented with Zinc Phosphate cement as compared to Panavia 21 or Fuji Plus may be the result of different characteristics of the luting agents (conventional cementation versus bonding). Zinc Phosphate is characteristically very stiff cement and spring elements with very high stiffness values positioned between the cement and the materials on either side of the cement space produce a very rigid interface in the bridge model. Fuji Plus and Panavia 21 are characteristically less rigid and therefore spring elements with lower stiffness values can be used at the cement space interfaces.
Following examination of the displacement patterns it is equally important to examine the stress patterns in the bridge model. Various stress values are indicated in finite element reports as Von Mises stress values within the various elements of the model. The distribution of stresses in the various areas of the model can be determined by matching the colors in each element to the scale in the upper left hand corner of an illustration (Fig 12.).
Fig. 12. Coping Von Mises Stress Patterns With Zinc Phosphate Cement.
Von Mises stresses are considered to be very accurate for determining fracture conditions when evaluating a three-dimensional structure. Brittle failure is demonstrated in a stress vs. strain graph where a smooth curve is seen until failure that manifests itself as fracture. For materials behaving in this manner, the “yield strength” and the “ultimate strength” are usually the same. The compressive strength of brittle materials such as ceramics is usually many times greater than the tensile strength. In general, the ultimate tensile strength is approximately the same as the modulus of rupture.
The three-dimensional nature of the stress state makes evaluation even more critical for an accurate representation of the failure potential of a structure, which is one of the strengths of the Von Mises stress patterns. Von Mises stress levels are a combination of Normal Stress Components in the XX. YY, ZZ-axes, and Shear stress components XY, YZ, XZ-axes. It becomes important to be sure that the major normal stress component contributing to the Von Mises stress value is tensile stress and not compressive stress when evaluating a ceramic bridge. A positive normal stress component is recognized as a tensile stress while a negative value represents compressive stress. In the bridge models, which were basically three-point bending test models, the loading was uniaxial in direction and the normal stress component in the XX-axis was the major contributor to the stress patterns as compared to the other normal stress components YY and ZZ (Fig. 13).
Fig. 13. Coping Von Mises Stress Patterns With Fuji Plus.
In the bridge models, high Von Mises stress values should be concentrated in two regions; one at the loading region and the other beneath the loading site in the lowest element area and extending into the copings, cement and teeth. This typical stress pattern was observed in all bridge models. The high Von Mises stress concentrations in all models were extended from the sides of the pontic through the joints to the sides of the copings. The distinguishing differences of the Von Mises stress patterns found among the three models with the different cement materials was the stress patterns effecting the copings. For the bridge cemented with Zinc Phosphate, high Von Mises stress values were found on the coping walls located nearest the pontic (Fig. 12).
For the bridge models cemented with Fuji Plus or Panavia 21, high Von Mises stress values were observed on the coping walls located the farthest from the pontic (Fig. 13).
The differences in Von Mises stress patterns between the bridge models cement by different cement materials also may be caused by the different characteristics of the cements.
In Figs 14 and 15, the XX-axes stress patterns in the upper region of the pontic are compressive stress (a negative stress in the XX-axis), and the ceramic would not fail in these region stress (See values color box in the left corner of the illustration.).
Fig. 14. Coping XX-axis Stress Patterns With Zinc Phosphate Cement.
The stresses in the lower region of the pontic are positive and the areas are experiencing tensile stress (See color Box).
Fig. 15. Coping XX-axis Stress Patterns With Fuji Plus.
If the Von Mises value in Figs 12 or 13 in these tensile stress areas exceed the ultimate strength of the ceramic material then failure would occur in this areas.
Recognizing that the 3-unit all-ceramic bridge is in reality a three-point bending model, investigators anticipated that the primary areas of interest with respect to the potential for failure would be the cement and/or joint space (See Fig. 16).
Fig. 16. The High Risk Area for Failure Are the Cement and The Joint Spaces.
Comparing the Von Mises stress values in Figs 12 and 13 in the high areas illustrated in Fig. 16 with the ultimate tensile strengths of the material in question in Table 1 will establish if failure has occurred.
Table 1. Ultimate Tensile Strength of Materials in Bridge
Material
Human Dentin
Aluminum Oxide
Connecting/Fusing Material
Zinc Phosphate
Fuji Plus
Panavia 21
Ultimate Tensile Strength
240 MPa
508 MPa
352 MPa
6.9 MPa
23.7 MPa
39.2 MPa
Failure of the Bridge
In the processing phase of the
FEA, the 3000 N load was applied on the superior surface in the center
of the pontic. The load was applied in ten (10) increments or until the
3000 N was reached. Figs 17 and 18. illustrate the responses of the model
in the high-risk areas defined in Fig. 16 to the load application under
different cementation conditions. The Normal Stress Components in the
XX-axes in Figs 14 and 15 demonstrated that those elements in the cement
space and the joint space were all experiencing tensile stress. Comparing
the Von Mises stress levels in elements in risk in Figs. 12 and 13 to
the ultimate tensile strength for the materials in these areas in Table
1, it was determined if failure occurred. The results are presented in
Table 2.
Table 2. Load to Fracture of Procera AllCeram Bridge
Cement Material
Zinc Phosphate
Fuji Plus
Panavia 21
Cement Failed
322 N
Joint Failed
699 N
710 N
When the bridge was cemented with Zinc Phosphate illustrated in Fig 17, the cement itself was the first material to experience a tensile stress that was greater than the ultimate tensile strength of the cement. The FEA predicted that cement failed would occur if the load exceeded 322 N. Failure of the cement would cause loosening of the copings at the ends of the bridge which could result in fracture of the coping.
When the bridge was cemented with Fuji Plus illustrated in Fig. 18 or Panavia 21, the cements did not fail under the loading conditions. The FEA predicted that failure would occur in the lower elements of the joint material. The bridge joint would fail when the load reached 699 N for Fuji Plus and 710 N when the cement used was Panavia 21.
DISCUSSION
The investigators must estimate the validity of the results before conclusions can be drawn. Checking of the modeling assumptions and resulting predicted behavior, and correlation with other engineering calculations or experimental results, all contribute to estimating the validity of the results.
Comparing the data from the FEA against the mechanical data perform as part of this investigation demonstrated an extremely close correlation. The mean load to fracture value for the five Procera AllCeram bridges cemented with Fuji Plus and subjected to mechanical testing was 697 ± 102 N. The FEA data predicted failure of the Procera AllCeram bridges cemented with Fuji Plus at 699 N. The mechanical test results and the FEA demonstrated that failure began at the bottom of the joint area between the copings and the pontic. The FEA for bridges cemented with Zinc Phosphate predicted that failure would occur in the cement before any bridge failure.
In reporting the strength of an all-ceramic bridge, it is important to know the biting force of the human dentition in order to determine the strength requirements needed in a ceramic bridge positioned in the oral environment. It has been reported by Craig6 that the average biting force on adult teeth in the first and second molars is 665 N (Newton), the premolars 450 N, and the incisors 220 N. A Newton is converted to pounds per square inch dividing by 4.44. In general however, biting forces on a fixed partial denture (bridge) are much lower.
Chewing forces are lower than biting forces. In general, chewing forces with a fixed partial denture are about 40% of the biting force exerted by the patient on the natural tooth side. On the basis of the information published by Craig5, it would seem appropriate to use the average biting force reported by Craig for adult natural teeth in the molar area to establish the Procera bridge target strength. A target strength of 675 N that would exceed the mean biting force of natural teeth would seem appropriate.
When a load is applied as pressure to a material, there is a resistance in the material to the external load. The pressure is distributed over an area, and the ratio of the pressure to the area is called the stress. Thus, for a given pressure, the smaller the area over which it is applied, the larger the value of the stress. Conditions exist in the mouth where contact areas of 0.645 mm2 (0.001 in2) frequently occur. In such small areas, a pressure of 111 N can readily be applied and produce a stress as large as 172 N (111 N/0.645 mm2 = 172 N/ mm2).
Several types of stress may result when a load is applied to a material. These are referred to as compressive, tensile, or shear stress. A material is subjected to compressive stress when the material is squeezed together, and to tensile stress when pulled apart. Shear stress occurs when one portion (plane) of the material is forced to slide by another portion of the material. Loads that are the direct result of functional and nonfunctional activities in the oral environment produce these types of stress. These loads are the result of teeth contacting during chewing (functional) and bruxing and clenching (nonfunctional) that involve vertical, lateral or protrusive occlusal contacts or a combination of these directional load applications. These load applications can also occur in the absence of direct occlusal contact, as during chewing, when a material is position between the occlusal surfaces of opposing teeth.
The elastic limit and yield strength of a material indicates the stress at which the material no longer functions as an elastic solid. The material will recover from the strain below the elastic limit if the stress is removed, however, permanent deformation of the material will occur if the strain is increased above the elastic limit. The elastic limit is the stress on a stress-strain curve when it ceases to be linear or when the ratio of the stress to the strain is no longer proportional. If higher loads are applied to a material beyond the yield strength, a stress will eventually be reached that will cause the material to fracture or rupture. The point at which fracture occurs is called the ultimate strength of the material and is reported in megapascals (MPa).
If a fracture occurs from tensile stress, the property is called the tensile strength and if in compression, the compressive strength. The tensile and compressive strength of a material may be significantly different. In the case of a restoration fabricated from ceramic materials, the compressive strength is usually very high while the tensile strength is low. For these materials there is little or no plastic range. In fact for most ceramic materials, the yield point and the ultimate tensile strength may be almost the same.
A target strength for an all-ceramic bridge at 675 N that would exceed the mean biting force of natural teeth in the molar region has been suggested by the study investigators. The load to fracture data for Procera AllCeram Bridge in this investigation from the mechanical tests (697 ± 102 N) and FEA exceeded this target strength. The load to fracture for the bridge cemented with Fuji Plus was 699 N) and cementation with Panavia 21 was 708 N. Therefore the Procera AllCeram bridge can be used in any location in the oral environment. The load to fracture data for a bridge cemented with Zinc Phosphate would not appear to meet the target strength test because the cement could potentially fail at 322 N. It has been reported that forces in general are lower on a fixed partial denture than natural teeth. Also, that chewing forces are lower than biting forces and are about 40% of the biting force, then loads of 270 N (675 N x .40 = 270 N) would be more common inpatient with a bridge. Thus, the potential for fracture to occur with the Procera AllCeram Bridge may not be a problem even when cementation is with Zinc Phosphate. Further support for the use of Zinc Phosphate can be found in reports indicating frequent use of this cement in the absence of significant fractures with single Procera crowns.
CONCLUSIONS
Within the limitations of this study evaluating the strength of the Procera® AllCeram Bridge the following conclusions can be made:
1. From mechanical testing and FEA, the Procera AllCeram Bridge has the strength to withstand approximately 700 N of load when the bridge is cemented with resin modified glass ionomer cement or resin cement.
2. According the FEA, cementation of the Procera AllCeram Bridge using Zinc Phosphate could potentially result in failure of the cement at a load in excess of 322 N.
REFERENCES
1. Andersson M, Razzoog ME, Odén A, Hegenbarth EA, Lang BR. PROCERA: A new way to achieve an all-ceramic Crown. Quintessence Int 1998;29:285-296.
2. Andersson M, Odén A. A new All-Ceramic Crown: A densely-sintered, high-purity alumina coping with porcelain. Acta Odontol Scand 1993;51:59-64.
3. Russell MM, Andersson M, Dahlmo K, Razzoog ME, Lang Br. A new computer-assisted method for fabrication of crowns and fixed partial dentures. Quintessence Int 1995;26:757-763.
4. Hegenbarth EA. Procera aluminum oxide ceramics: A new way to achieve stability, precision, and esthetics in all-ceramic restorations. Queintessence Dent Tech 1996:23-34.
5. Rui IADR
6. Craig RG and Powers JM. Mechanical Properties In: Restorative Dental Materials. 11th Edition CV Mosby Co., 2002. P. 68-124. November 29, 2001
Close Window to continue.