| Thanksgiving Dinner Example | top |
Our extended familt consists of 25 people who will be attending our celebration. Let's consider our dinner menu:
| Time Requirements | ||
| Main Course: | Roasted turkey (of course) with dressing (studding) | clean (1/2 hr), stuff (1/2 hr), cook (7 hrs at 350°F), cool and slice (1 hr) |
| Vegetable: | Green beans with mushroom sauce | prep. time (30 min), microwave (30 min) |
| Patato: | Sweet potato casserole | prep. time (30 min), cook (2 hrs at 350°F) |
| Sauce: | Jelly cranberry sauce | open can, slice, serve |
| Dessert: | Pumpkin Pie | prep. time (3/4 hr), cook (1 hr at 425°F |
| Beverages: | Coffee, Tea, Milk, Water, White wine | prep. time (minimal) |
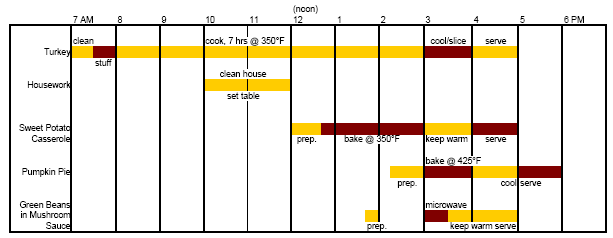
Clearly, the successful preparation and serving of the Thanksgiving meal will require substantial planning and coordination by the cook. A Gantt Chart will help us organize our time and resources (stove, microwave, etc.). We'd like to sit down to eat at 4 PM. The longest "lead-time" item is the turkey, which requires 9 hours to prepare. Thus, using the turkey as a yardstick, we must begin our preparations by at least 7 AM (a long day for the cook!). Let's try to fit this into a Gantt Chart for the preparation of the entire meal.

The Gantt Chart shows the hectic nature of the Thanksgiving dinner preparations clearly. Any time conflicts should be apparent from the chart.
Another example of the use of critical path management is for the preparation of the annual Thanksgiving diner. For the meal to be served on time (and to keep the guests happy) there are several critical steps in the preparation that must be completed in a timely manner or substantial delays will result. In the figure below. for example. the bold lines and boxes indicate the critical path. It refers to items that require a fair amount of time lo complete. If the schedule "slips," the meal will be delayed. For example, the turkey requires approximately eight hours to clean, stuff, and cook. If the preparation of the turkey is delayed, chances are the serving time will be delayed too. The sweet potato casserole also requires a long time to complete (more than 3.5 hours), so it is critical that it is completed on schedule, or the meal will be delayed. Noncritical path items, such as setting the table, cleaning the house, and preparing the pie for baking, can be done as time permits after the critical items are completed.

| The Minimum Number of Experiments (or. . . "Getting the Most Bang for Your Buck") |
top |
The minimum number of experiments that must be performed is related to the number of important independent variables that can affect the experiment and to how precisely we can measure the results of the experiment. In designing the experiments, we will first choose two levels (i.e., settings) for each independent variable. Because these levels are usually at the extremes of the variable range, we refer to these settings as high and low (e.g., on/off, red/green, 100 psi/14.7 psi, 100°C/0°C, etc.). For example, consider an experimental program where the dependent variable is a function of three independent variables (A, B, and C), each of which can take on two possible values or levels.
| Independent Variable Names | Possible Levels | |
| A | High | Low |
| B | High | Low |
| C | High | Low |
| An automatic camera (one that automatically selects the shutter speed and aperture operating for given conditions) can have a number of variables associated with it, for example, film speed, flash, and focus. Each of these independent variables will affect the dependent variable, the picture quality. The levels of these variables are |  |
| Variable | Symbol | High (+) | Low(-) |
| Film Speed | (A) | 400 ASA | 100 ASA |
| Flash | (B) | ON | OFF |
| Focus | (C) | IN | OUT |
If all possible variable combinations were to be tested, the number of experiments is equal to the number of levels, N, raised to the power of the number of independent variables, n. For the camera example, the number of experiments necessary to test all combinations of independent variables is equal to Nn = 23 = 8 experiments. These are detailed below ((+) indicates a high level, while (-) indicates a low level of a particular variable).
| Experiment No. | A | B | C |
| 1 | - | - | - |
| 2 | + | - | - |
| 3 | - | + | - |
| 4 | - | - | + |
| 5 | + | + | + |
| 6 | - | + | + |
| 7 | + | - | + |
| 8 | + | + | - |
If there is no interaction among the variables (which may not be known beforehand), experiments 1-4 will yield all the necessary information. By no interaction, it is meant that each of the variables affects the outcome of the experiment independently and there is no synergistic effect of a combined interaction. When there is no interaction, the effect of variable A changing from a high value to a low value is always the same, regardless whether or not the values of B and C are high or low. For example, there is no interaction between the focus and flash because if the camera is out of focus, it will be out of focus for both cases of the flash (ON/OFF) and it will also be out of focus no matter what film speed is used. On the other hand, there is interaction between the flash and the film speed because a flash might be necessary (ON+) at low film speeds but not at high film speeds (OFF-).
Experiments 1-4 explore the effect of raising each variable, in turn, from its low level to its high level. In this type of situation, the minimum number of experiments that must be run is the number of independent variables plus one (3 + 1 = 4). Thus, if there is no interaction, we need only examine each variable individually at the high level, and we can predict the results of the other experiments (5 through 8) by combinations of the appropriate responses.
| Experiment No. | A | B | C | Comments |
| 1 | - | - | - | Base Case |
| 2 | + | - | - | Reveals effect of high A |
| 3 | - | + | - | Reveals effect of high B |
| 4 | - | - | + | Reveals effect of high C |
A full factorial design (all eight experiments in this case) is useful for developing a model to predict the outcome of experiments whose independent variables can change continuously (that is, they can assume a continuous range of values and not just two discrete values). Two levels (at least) of each of the variables are examined and the results can be interpreted in the form of a model to predict the outcome of future experiments. Deming† discusses this method of statistically designing experiments.
† Deming, S. N., "Quality by Design, Part 5," Chemtech, p. 118, February 1990.
| Popcorn Example | top |
| As an example of a Type I Error, consider the case of a series of experiments designed to determine the "popping efficiency" (defined as the percent of kernels popped) of a new brand of popcorn developed by James Wilson. James had growers producing his popcorn in different parts of the country, and he was interested in the "popping efficiency" of the corn from different growers. James tested the corn samples provided by the various growers of his new strain of corn and he concluded that two of the farmers from the state of Iowa produced corn with a significantly higher popping efficiency than growers from other locations. This result led James to the conclusion that the quality of the popcorn is very sensitive to the growing locations, and he should concentrate on producers in Iowa to supply his corn. Further investigation proved this to be a Type I Error. That is, the key variable that James overlooked was that the Iowa farmers who supplied the superior corn took great care to preserve the freshness and hence moisture content of the kernels in the final product. When the farmers from other locations took the same precautions to prevent excess drying as a result of long storage times, their corn popped equally well. Thus, James's declaration that growing location is a significant variable was a Type I Error. The usual penalty for such an error is a loss of credibility. A Type II Error would exist if James failed to realize that the age and the corresponding moisture content of the un-popped kernels were significant process variables. |  |
 |
To illustrate the method for determining the minimum number of experiments, let's return to James Wilson, the popcorn entrepreneur, and help him design a series of experiments to measure the popping efficiency of his new popcorn. James would like to compare his new gourmet popcorn with a popular brand sold nationally. He has identified two important process variables he would like to consider: degree of freshness and method of popping (hot oil versus hot air). He plans to use accelerated aging by heating the fresh kernels in an oven at 75°C for a fixed period of time to simulate the aging process. Let's consider a series of experiments that James might perform, using two levels of each of the three independent variables. We will indicate the high level of a variable with a plus sign (+) and a low level with a minus sign (-).
Note that the classification by level is arbitrary; it serves only to indicate that each independent variable of interest can have two different levels (settings). Remember, what James is interested in is the effect of these three independent variables on the "popping efficiency" (kernels popped per hundred kernels). If we were to check all possible combinations of these variables, we would need to perform eight different experiments:
This covers all possible combinations. It is easier to "see" the pattern if we repeat the table using the (+) and (-) indications of the level.
The pattern is now clear: The first four experiments examine the base case (low, low, low) and the effect of raising each variable in turn from its low level to its high level. The second four experiments examine the base case (high, high, high) and the effect of lowering each variable in turn from its high level to its low level. If there is no interaction among the variables, then we can "get by" with only doing four experiments (either 1-4 or 5-8). For example, if aging has the same effect on all types of kernels, we need only examine the effect of aging on either James's or gourmet popcorn to determine its effect on all kernels. Hence, we could gather the necessary aging information from experiments 1 and 4, while runs 5 and 8 would not be necessary. If, however, there was some interaction among the variables, then all eight runs would be necessary. For example, let's suppose one of the kernel types has a thicker shell that is more resistant to moisture loss during aging. The effect of aging would then be different for the different kernels and we would require the additional runs to explore the interactions. |
||||||||||||||||||||||||||||||||||||||||||||||||||||||||||||||||||||||||||||||||||||
 |
The results of James Wilson's popcorn efficiency testing were as follows: Note that because of the variable nature of the kernels, James repeated each of the experiments several times.
| Experiment No. | Popcorn Type | Freshness | Popping Method | % Unpopped | |||||
| Theater's Brand (-) | Aged (-) | Oil (-) | Runs | ||||||
| James's Brand (-) | Fresh (+) | Air (+) | 1 | 2 | 3 | 4 | 5 | Avg | |
| 1 | - | - | - | 22 | 18 | 19 | 26 | 25 | 22 ± 4.4 |
| 2 | + | - | - | 16 | 15 | 15 | 14 | 15 | 15 ± 0.9 |
| 3 | - | + | - | 15 | 17 | 16 | 13 | 14 | 15 ± 1.9 |
| 4 | - | - | + | 19 | 18 | 18 | 21 | 17 | 18.6 ± 1.8 |
| 5 | + | + | + | 4 | 7 | 2 | 5 | 3 | 4.2 ± 2.4 |
| 6 | - | + | + | 12 | 14 | 15 | 13 | 13 | 13.4 ± 1.4 |
| 7 | + | - | + | 10 | 9 | 13 | 11 | 10 | 10.6 ± 1.8 |
| 8 | + | + | - | 3 | 5 | 5 | 7 | 4 | 4.8 ± 1.8 |
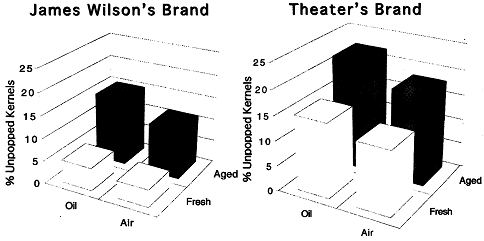
The mean percent unpopped kernels are shown in the right-hand column of the table for each set of experimental conditions. The variations about the mean (± value shown) were calculated using the student t-test (see Appendix A2.4, p. 192). For illustrative purposes, the means are plotted on bar charts shown below for the two different types of popcorn.
 |
Even though James's brand is clearly superior to the Theater's brand under all conditions, there appears to be a significant effect of aging that he is interested in exploring before taking his information to the theater chain. He decides to design a series of experiments to study aging of the kernels. The accelerated aging experiments will be performed in a constant temperature, constant humidity environment (oven) for varying lengths of time. Additionally, because of the inherently variable nature of the popcorn kernels, several samples will be taken for each set of conditions. The results of James's experiments are summarized below. The error bars (the ± values) were calculated using the t-test (see Appendix A2.4, pp. 192-194). |
| DaysAged | Run1 | Run2 | Run3 | Run4 | Run5 | Average | (±) |
| 0 | 4 | 5 | 5 | 4 | 3 | 4.2 | 1.04 |
| 1 | 7 | 6 | 8 | 7 | 7 | 7 | 0.87 |
| 2 | 9 | 9 | 8 | 8 | 7 | 8.2 | 1.04 |
| 5 | 8 | 9 | 9 | 10 | 11 | 9.4 | 1.41 |
| 10 | 11 | 13 | 13 | 12 | 14 | 12.6 | 1.41 |
| 15 | 16 | 17 | 16 | 15 | 17 | 16.2 | 1.04 |
| 20 | 19 | 21 | 21 | 20 | 19 | 20 | 1.24 |
| 25 | 24 | 23 | 23 | 22 | 24 | 23.2 | 1.04 |
| 30 | 25 | 25 | 27 | 23 | 24 | 24.8 | 1.85 |
| DaysAged | Run1 | Run2 | Run3 | Run4 | Run5 | Average | (±) |
| 0 | 5 | 5 | 5 | 5 | 4 | 4.8 | 0.55 |
| 1 | 9 | 8 | 8 | 7 | 8 | 8 | 0.87 |
| 2 | 10 | 11 | 10 | 12 | 9 | 10.4 | 1.41 |
| 5 | 13 | 12 | 13 | 12 | 11 | 12.2 | 1.04 |
| 10 | 16 | 15 | 15 | 16 | 17 | 15.8 | 1.04 |
| 15 | 18 | 19 | 19 | 21 | 17 | 18.8 | 1.85 |
| 20 | 21 | 23 | 23 | 22 | 24 | 22.6 | 1.41 |
| 25 | 24 | 25 | 26 | 26 | 25 | 25.2 | 1.04 |
| 30 | 27 | 26 | 26 | 27 | 28 | 26.8 | 1.04 |
The average values along with the error bars are shown in the following graph.
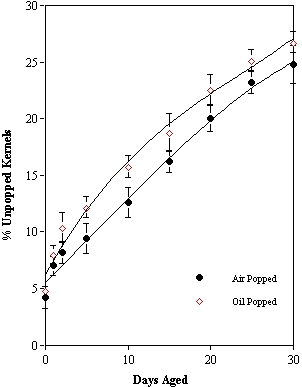
The graph indicates that there indeed is an effect of aging on the kernels. James postulates that this phenomenon is related to the kernels coming to equilibrium with the temperature/humidity conditions in the oven. There also appear to be similar effects of aging on oil and air popping . The error bars indicate that air popping seems to provide a more efficient means of popping the kernels, but the effect is not very great.
| Heat Exchanger Example | top |
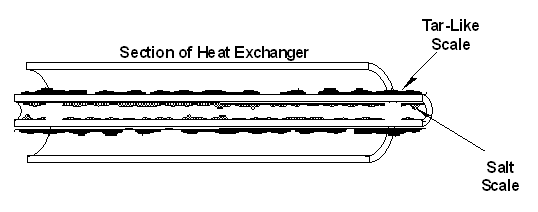
We now return to the heat exchanger problem discussed in Chapter 4 in which it was learned that the real problem was to remove the scale from the heat exchanger rather than designing and building a larger heat exchanger. Typically there can be scale on the inside and on the outside of the heat exchanger tubes. If we have an organic liquid on the outside of the tubes and water inside the tubes, the scales on either side of the tube will be different in nature. The organic scales are tar-like and the water scales are usually mineral salts.
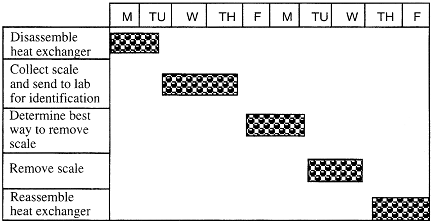
As shown in the Gantt Chart below, a day and a half (all day Monday and Tuesday morning) are devoted to disassembling the heat exchanger. Two and a half days, Tuesday noon through Thursday, are allotted to remove the scale and get the lab results. Each of the remaining tasks in the process is scheduled in a similar manner.
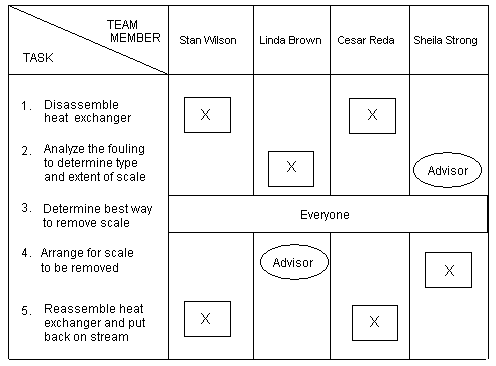
For example, let's again consider the example of cleaning the scale (fouling) from the heat exchanger in order for it to operate more efficiently. Cesar and Stan will disassemble and reassemble the equipment. Linda will analyze the scale to determine the type and amount. Sheila will help Linda with the analysis and will also be the one responsible for seeing that the scale is properly removed. The remaining tasks and assignments are shown in the following Deployment Chart for cleaning the heat exchanger.
As an example of critical path management, let us return to the Cleaning the Heat Exchanger example. The organic scales are typically removed by dissolving them with an appropriate solvent, while the water (mineral) scales are removed with high-pressure water jets. Removing the organic tar scale by soaking in a solvent is a much slower process than high-pressure jet cleaning. Thus, the tasks associated with cleaning the organic tar is the "critical path" for keeping the project on schedule. If any of the tasks associated with this removal are delayed, the overall project will be delayed.
The figure below shows a critical path time line diagram. The critical path is indicated by the heavy black lines. Particular attention must be given to the tasks on this path so that they stay on schedule and the overall project is not delayed.
| Revealing the Solution | top |
A procedure for carrying through a solution that has many facets or components is one that is adapted from Bloom's Taxonomy. In this procedure, the activities are arranged from the most difficult (synthesis) to the easiest (comprehension). The description of these activities carried out is as follows: Evaluation, Synthesis, Analysis, Application, Comprehension, and Knowledge. The Carry Through Process adapted from Bloom's Taxonomy is shown at the left.
Evaluation: Evaluation is an ongoing process throughout the entire problem-solving process. Qualitative and quantitative judgments about the extent to which the materials and methods satisfy the external and internal criteria should be made.
Synthesis: This activity is the putting together of parts to form a new whole. Synthesis enters into problem solving in many ways. Given a fuzzy situation, synthesis is the ability to formulate (synthesize) a problem statement and/or the ability to propose a method of testing hypotheses. At the end of this activity we have defined the problem, generated a number of potential solutions and decided on which solution to implement.
Once the various parts are synthesized, each part (problem) now uses the intellectual skill described in analysis to continue toward the complete solution.
Analysis: This activity is the process of breaking the problem into parts such that a hierarchy of subproblems or ideas is made clear, and the relationship among these ideas is made explicit. In analysis, one identifies missing, redundant, and contradictory information.
Once the analysis of a problem is completed, the various subproblems are then reduced to problems requiring the use of application skills.
Application: This activity recognizes which set of principles, ideas, rules, equations, or methods should be appied, given all the pertinent data.
Once the principle, law, or equation is identified, the necessary knowledge is recalled, and the problem is solved as if it were a comprehension problem.
Comprehension: This activity involves understanding, manipulation, and/or extrapolation of the knowledge (i.e., principle, equation) we identified in the Application Step to solve a given problem. That is, given a familiar piece of information, such as a scientific principle, can the problem be solved by recalling the appropriate information and using it in conjunction with manipulation, translation, or interpretation of the equation or scientific principle?
Knowledge: Knowledge is remembering previously learned material. It is used in each step of Bloom's method of unraveling. Here we ask, "Can the problem be solved simply by defining terms and by recalling specific facts, trends, criteria, sequences, or procedures?"
The main advantage of using Bloom's Method is that it allows us to unravel the solution. That is, completion of each step (e.g., analysis) uncovers the next step to be worked on (e.g., application). Of course, additional knowledge must be injected into each step along the way.
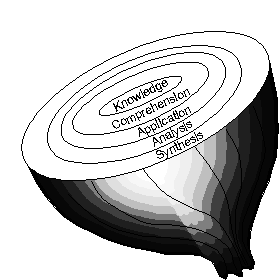
As an example of this "unraveling" procedure, let's apply the adaptation of Bloom's Method to unravel a problem and see how it works. The Carry Through process actually begins after we have defined the problem and synthesized a solution.
Your company has purchased a gas field in the coastal waters off Louisiana in order to have a supply of methane gas for your chemical plant on the western coast of Florida. Use Bloom's taxonomy to unravel a plan to get the gas from the field to the chemical plant.
SYNTHESIS
The first problem statement is: "Find a way to transport the gas from Louisiana to Florida." We begin this task by generating ways to accomplish the transportation. The techniques in Chapter 4 will greatly aid us in addressing this first task. Some of the ways this might be accomplished are to build a pipeline from the field to the plant, to ship by rail, or to ship by sea. A K.T. Decision Analysis shows that building a pipeline is too expensive and that the plant is not anywhere near a rail line. Consequently, the transport of the gas will take place by liquefying the gas and then shipping it to the chemical plant by boat. The next statement is: "Design a system that will liquefy 2000 lbs of methane per hour for shipment by boat from Louisiana to Florida."
EVALUATE
Before proceeding further to carry out a detailed design and sizing of the various pieces of equipment, we need to pause and evaluate the overall scheme. That is, we need to stop and do a preliminary evaluation of the proposal to ship compressed methane to the Florida plant. In the next chapter, we discuss the various items to consider in the evaluation phase. For example, is this scheme reasonable? What does a Potential Problem Analysis reveal?
ANALYSIS
In the analysis step we break the problem into parts and then examine each part. In order to liquify the methane, it must be compressed and cooled. The liquid methane will then be pumped into the ship. After shipping, the methane will be off-loaded at the plant in Florida.
In this example, an analysis reveals the parts are a compressor, a heat exchanger, a pump, and a ship. Having recognized that we need a compressor to liquefy the gas, we collect information to learn what pressure and temperature are necessary to liquefy and transport the methane. Next we determine which type of compressor we should use. Should it be a centrifugal or a reciprocating pump?
The gas enters the compressor at 200 psi and 110°C, and is to be compressed to 1000 psi. In order to design the heat exchanger, we must know the temperature of the gas as it leaves the compressor and enters the heat exchanger. Other points to be addressed at the analysis stage are the number of pumps required, and whether interstage cooling is required between the pumps. (K.T. Decision Analysis was used and a reciprocating pump operating close to adiabatic conditions was chosen.)
APPLICATION
We are going to use a reciprocating pump compressor and we need to know the temperature exiting the pump before we can design the heat exchanger. In the application stage, we recall the laws that apply and what assumptions are reasonable.
For adiabatic operation we recall (or look up) the pressure-volume relationship for a gas compressed adiabatically:
P = pressure, kPa,Note: We could also have considered departures from ideal gas law behavior.= specific volume, m3/mol, T = temperature, K
γ = ratio of specific heats = Cp/Cv, R = Ideal Gas Constant, (m3•kPa)/(mol•K)
COMPREHENSION
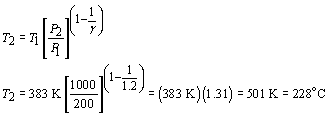
Here we manipulate the equations in order to predict the exit temperature from the compressor.
EVALUATION
Are the numbers reasonable? Use the "Evaluation Checklist" in Chapter 9 to evaluate the solution. A check of related problems in thermodynamics texts shows that this is indeed a reasonable number.
| Critical Path Management | top |
Critical path management allows us to identify the critical points in the process.
These critical points are readily identified by determining which tasks will cause substantial delays in the implementation of the solution if the schedule is not met.
Suppose Jason and Melinda decide to use critical path management for the development of the Web site described in the preceding example.
In the next fig- ure, the bold lines and boxes indicate the critical path. It identifies items that require a fair amount of time to complete. If the schedule "slips," the Web site's "go live" date will be delayed. In this case, the development of the content and graphics with the customer takes the longest time and the site cannot be finalized until this task is completed; thus it is critical that this task be completed on sched- ule or the Web site commissioning will be delayed. Non-critical path items, such as contracting with an Internet Service Provider (ISP), can be done as time per- mits after the critical items are completed.
Critical Path Management of a Web Site Development Project
A word of caution is in order here: If non-critical path items are completed too slowly, they can become critical path items. Thus using a critical path diagram is a dynamic process. The diagram should be continually updated as tasks are completed, so that you can view the overall progress of the project as a whole.
| What Happens When the Goal Keeps Changing? | top |
In the 1870s, a military fort was built in the west near a small village on the northern plains. As the first winter approached, the captain of the garrison sent his men to the forest to obtain firewood. The initial goal was to chop down enough trees to stack eight cords of wood. The captain then asked the corporal to ride over to the village to ask an old settler how cold the winter would be, with the goal of determining whether the soldiers he had cut a sufficient amount of wood to last the winter.
When the corporal arrived at the village and asked the old settler, the old settler put his hand to his forehead, looked toward the fort and said, "Cold winter!" The corporal reported this to the captain, who ordered that eight more cords of wood be cut and stacked.
The captain then asked the corporal to check once again with the old settler as to how cold the winter was going to be. The old settler looked to the sky in the direction of the fort and this time said, "Cold, cold winter!" When the corporal reported to the captain, the captain ordered eight more cords of wood to be cut; he then asked the corporal to check once again with the old settler. The old settler looked toward the fort and said, "Cold, cold, cold winter!"
The corporal said, "Wait a minute. The first time you said 'Cold winter,' the second time, 'Cold, cold, winter,' and now you say, 'Cold, cold, cold winter.' Why do you keep changing your mind and saying the winter is going to be colder and colder?"
"Because," said the old settler, "the soldiers at the fort keep stacking more and more wood for the winter!"
| Experimental Projects | top |
Do You Really Need the Experiments?
When you are preparing to initiate an experimental program, be sure to question yourself and others to help guide your progress. The following questions will help you dig deeper into your project.