
** Sustainable Worldwide Transportation ended its operation in March 2018. **
|
|
Sustainable
Worldwide
|
|
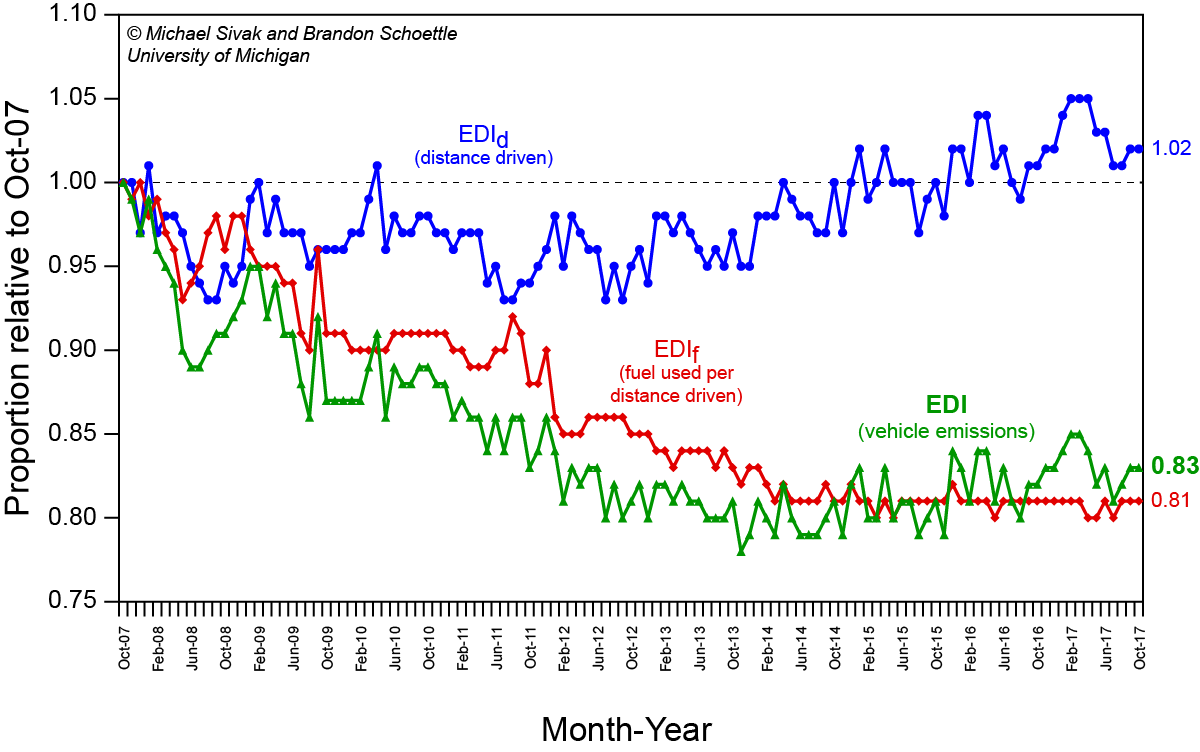
University of Michigan Eco-Driving Index (EDI)
and the two sub-indexes (EDId and EDIf) The values of the index (EDI) and of its two sub-indexes (EDIf and EDId) from October 2007 through October 2017 are shown in the figure and table below. The EDI for October 2017 stands at 0.83, indicating that there was an 18% reduction of emissions per driver of newly purchased vehicles compared to the situation in October 2007. (EDIf and EDId for October 2017 are 0.81 and 1.02, respectively.) Future monthly values of the EDI will be issued with a lag of about two months (due to lags in the availability of the underlying data). (Data for recent months are occasionally updated in the underlying FHWA and EPA data sources, possibly resulting in small changes to recent sub-index and EDI values.)
Latest data: October 2017. Last updated: January 3, 2018.
|
(click on the graph to view full size)
| Month-Year | EDId (distance driven) |
EDIf (fuel used per distance driven) |
EDI (vehicle emissions) |
| Oct-17 | 1.02 | 0.81 | 0.83 |
| Sep-17 | 1.02 | 0.81 | 0.83 |
| Aug-17 | 1.01 | 0.81 | 0.82 |
| Jul-17 | 1.01 | 0.80 | 0.81 |
| Jun-17 | 1.03 | 0.81 | 0.83 |
| May-17 | 1.03 | 0.80 | 0.82 |
| Apr-17 | 1.05 | 0.80 | 0.84 |
| Mar-17 | 1.05 | 0.81 | 0.85 |
| Feb-17 | 1.05 | 0.81 | 0.85 |
| Jan-17 | 1.04 | 0.81 | 0.84 |
| Dec-16 | 1.02 | 0.81 | 0.83 |
| Nov-16 | 1.02 | 0.81 | 0.83 |
| Oct-16 | 1.01 | 0.81 | 0.82 |
| Sep-16 | 1.01 | 0.81 | 0.82 |
| Aug-16 | 0.99 | 0.81 | 0.80 |
| Jul-16 | 1.00 | 0.81 | 0.81 |
| Jun-16 | 1.02 | 0.81 | 0.83 |
| May-16 | 1.01 | 0.80 | 0.81 |
| Apr-16 | 1.04 | 0.81 | 0.84 |
| Mar-16 | 1.04 | 0.81 | 0.84 |
| Feb-16 | 1.00 | 0.81 | 0.81 |
| Jan-16 | 1.02 | 0.81 | 0.83 |
| Dec-15 | 1.02 | 0.82 | 0.84 |
| Nov-15 | 0.98 | 0.81 | 0.79 |
| Oct-15 | 1.00 | 0.81 | 0.81 |
| Sep-15 | 0.99 | 0.81 | 0.80 |
| Aug-15 | 0.97 | 0.81 | 0.79 |
| Jul-15 | 1.00 | 0.81 | 0.81 |
| Jun-15 | 1.00 | 0.81 | 0.81 |
| May-15 | 1.00 | 0.80 | 0.80 |
| Apr-15 | 1.02 | 0.81 | 0.83 |
| Mar-15 | 1.00 | 0.80 | 0.80 |
| Feb-15 | 0.99 | 0.81 | 0.80 |
| Jan-15 | 1.02 | 0.81 | 0.83 |
| Dec-14 | 1.00 | 0.82 | 0.82 |
| Nov-14 | 0.97 | 0.81 | 0.79 |
| Oct-14 | 1.00 | 0.81 | 0.81 |
| Sep-14 | 0.97 | 0.82 | 0.80 |
| Aug-14 | 0.97 | 0.81 | 0.79 |
| Jul-14 | 0.98 | 0.81 | 0.79 |
| Jun-14 | 0.98 | 0.81 | 0.79 |
| May-14 | 0.99 | 0.81 | 0.80 |
| Apr-14 | 1.00 | 0.82 | 0.82 |
| Mar-14 | 0.98 | 0.81 | 0.79 |
| Feb-14 | 0.98 | 0.82 | 0.80 |
| Jan-14 | 0.98 | 0.83 | 0.81 |
| Dec-13 | 0.95 | 0.83 | 0.79 |
| Nov-13 | 0.95 | 0.82 | 0.78 |
| Oct-13 | 0.97 | 0.83 | 0.81 |
| Sep-13 | 0.95 | 0.84 | 0.80 |
| Aug-13 | 0.96 | 0.83 | 0.80 |
| Jul-13 | 0.95 | 0.84 | 0.80 |
| Jun-13 | 0.96 | 0.84 | 0.81 |
| May-13 | 0.97 | 0.84 | 0.81 |
| Apr-13 | 0.98 | 0.84 | 0.82 |
| Mar-13 | 0.97 | 0.83 | 0.81 |
| Feb-13 | 0.98 | 0.84 | 0.82 |
| Jan-13 | 0.98 | 0.84 | 0.82 |
| Dec-12 | 0.94 | 0.85 | 0.80 |
| Nov-12 | 0.96 | 0.85 | 0.82 |
| Oct-12 | 0.95 | 0.85 | 0.81 |
| Sep-12 | 0.93 | 0.86 | 0.80 |
| Aug-12 | 0.95 | 0.86 | 0.82 |
| Jul-12 | 0.93 | 0.86 | 0.80 |
| Jun-12 | 0.96 | 0.86 | 0.83 |
| May-12 | 0.96 | 0.86 | 0.83 |
| Apr-12 | 0.97 | 0.85 | 0.82 |
| Mar-12 | 0.98 | 0.85 | 0.83 |
| Feb-12 | 0.95 | 0.85 | 0.81 |
| Jan-12 | 0.98 | 0.86 | 0.84 |
| Dec-11 | 0.96 | 0.90 | 0.86 |
| Nov-11 | 0.95 | 0.88 | 0.84 |
| Oct-11 | 0.94 | 0.88 | 0.83 |
| Sep-11 | 0.94 | 0.91 | 0.86 |
| Aug-11 | 0.93 | 0.92 | 0.86 |
| Jul-11 | 0.93 | 0.90 | 0.84 |
| Jun-11 | 0.95 | 0.90 | 0.86 |
| May-11 | 0.94 | 0.89 | 0.84 |
| Apr-11 | 0.97 | 0.89 | 0.86 |
| Mar-11 | 0.97 | 0.89 | 0.86 |
| Feb-11 | 0.97 | 0.90 | 0.87 |
| Jan-11 | 0.96 | 0.90 | 0.86 |
| Dec-10 | 0.97 | 0.91 | 0.88 |
| Nov-10 | 0.97 | 0.91 | 0.88 |
| Oct-10 | 0.98 | 0.91 | 0.89 |
| Sep-10 | 0.98 | 0.91 | 0.89 |
| Aug-10 | 0.97 | 0.91 | 0.88 |
| Jul-10 | 0.97 | 0.91 | 0.88 |
| Jun-10 | 0.98 | 0.91 | 0.89 |
| May-10 | 0.96 | 0.90 | 0.86 |
| Apr-10 | 1.01 | 0.90 | 0.91 |
| Mar-10 | 0.99 | 0.90 | 0.89 |
| Feb-10 | 0.97 | 0.90 | 0.87 |
| Jan-10 | 0.97 | 0.90 | 0.87 |
| Dec-09 | 0.96 | 0.91 | 0.87 |
| Nov-09 | 0.96 | 0.91 | 0.87 |
| Oct-09 | 0.96 | 0.91 | 0.87 |
| Sep-09 | 0.96 | 0.96 | 0.92 |
| Aug-09 | 0.95 | 0.90 | 0.86 |
| Jul-09 | 0.97 | 0.91 | 0.88 |
| Jun-09 | 0.97 | 0.94 | 0.91 |
| May-09 | 0.97 | 0.94 | 0.91 |
| Apr-09 | 0.99 | 0.95 | 0.94 |
| Mar-09 | 0.97 | 0.95 | 0.92 |
| Feb-09 | 1.00 | 0.95 | 0.95 |
| Jan-09 | 0.99 | 0.96 | 0.95 |
| Dec-08 | 0.95 | 0.98 | 0.93 |
| Nov-08 | 0.94 | 0.98 | 0.92 |
| Oct-08 | 0.95 | 0.96 | 0.91 |
| Sep-08 | 0.93 | 0.98 | 0.91 |
| Aug-08 | 0.93 | 0.97 | 0.90 |
| Jul-08 | 0.94 | 0.95 | 0.89 |
| Jun-08 | 0.95 | 0.94 | 0.89 |
| May-08 | 0.97 | 0.93 | 0.90 |
| Apr-08 | 0.98 | 0.96 | 0.94 |
| Mar-08 | 0.98 | 0.97 | 0.95 |
| Feb-08 | 0.97 | 0.99 | 0.96 |
| Jan-08 | 1.01 | 0.98 | 0.99 |
| Dec-07 | 0.97 | 1.00 | 0.97 |
| Nov-07 | 1.00 | 0.99 | 0.99 |
| Oct-07 | 1.00 | 1.00 | 1.00 |
Publications | Fuel economy and emissions monitoring | Contact us
Page updated: Tuesday, April 3, 2018
Copyright © 2006-2018 The Regents of the University of Michigan, Ann Arbor, MI 48109 USA
 Download a PDF of the current EDI summary