Am I Decisive?
Handout for Government 317, Cornell University, Fall 1999
Walter Mebane
I compute the probability that one's vote is decisive in a majority-rule election between two candidates. Here, a decisive vote is defined to be a vote that breaks an exact tie among all the other voters. For simplicity I refer to the set of all the other voters as the electorate.
I show two different kinds of estimates of the probability that one's vote is decisive. One is the purely combinatorial estimate that one should use when one has no information at all about the likely choices of the electorate. The other is the conditional estimate one should use when there is poll data that tells one something about the electorate. The two estimates may have very different values. The differences between the estimates crudely measure the effect that information a person has about the distribution of others' vote intentions can have on the person's decision whether to vote. It is important both to keep those effects in mind and to develop ways to study them.
First let's derive the purely combinatorial estimate. To get anywhere, we
need to give a precise definition of what an electorate is. All we need to
know about an electorate is how many people are in it and how each person in
it will vote. Real life is much more complicated, but to focus solely on the
problem of estimation we will assume that each and every elector has a firm,
unchanging preference for one candidate or the other. Because everyone's vote
counts the same, all we really need to know about an electorate is its
vote split: how many people will vote for one candidate and how many
will vote for the other. I use the notation ![]() to denote an electorate's
vote split, where N is the total number of people and j is the number who
will vote for Candidate 1 (the remaining N-j people vote for Candidate 2).
One's vote is decisive only in an electorate that has vote split
to denote an electorate's
vote split, where N is the total number of people and j is the number who
will vote for Candidate 1 (the remaining N-j people vote for Candidate 2).
One's vote is decisive only in an electorate that has vote split ![]() .
.
The purely combinatorial probability that any particular vote split occurs,
given that the electorate has N people, is the ratio of the number of
possible electorates of size N that have that vote split to the total number
of electorates of size N that are possible. The number of possible
electorates that have vote split ![]() is given by the binomial coefficient,
is given by the binomial coefficient,
![]()
where ![]() . The total number of possible
electorates of size N is the number of patterns in which N people may
vote. That number is
. The total number of possible
electorates of size N is the number of patterns in which N people may
vote. That number is ![]() (the number 2 raised to the power N). The
purely combinatorial probability that vote split
(the number 2 raised to the power N). The
purely combinatorial probability that vote split ![]() occurs is therefore
occurs is therefore
![]()
The purely combinatorial estimate of the probability that one's vote is decisive, in an electorate of size N, is therefore
![]()
Notice that ![]() is the same as the formula derived by Hinich and
Munger (1997, 147).
is the same as the formula derived by Hinich and
Munger (1997, 147).
If poll data exist, one should use the data to improve one's estimate of the
probability that one is decisive. The question to be answered is, given that
the poll data are thus and so, what is the probability that the electorate
that was polled is an electorate that has vote split ![]() . The poll data
come from the actual electorate, that is, from the electorate that actually
exists. So the question really is, given that the poll data are thus and so,
what is the probability that the actual electorate is one in which one's vote
is decisive. One learns from the poll data a bit about the characteristics of
the electorate that actually exists.
. The poll data
come from the actual electorate, that is, from the electorate that actually
exists. So the question really is, given that the poll data are thus and so,
what is the probability that the actual electorate is one in which one's vote
is decisive. One learns from the poll data a bit about the characteristics of
the electorate that actually exists.
I use a highly simplified model of how the data in a poll are created. I
assume that a poll that uses a sample of n observations is conducted by
repeating the following exercise n times: select one person from the
electorate, totally at random, with probability 1/N; record that person's
vote intention. The same person may be selected at most one time for
inclusion in the poll. Real polls differ from this idealized procedure in
many ways. In the idealized model of a poll that I am using, the result is a
pair of counts: ![]() records the number of votes in the poll for Candidate 1,
and
records the number of votes in the poll for Candidate 1,
and ![]() records the number of votes for Candidate 2, with
records the number of votes for Candidate 2, with ![]() . I
use the notation
. I
use the notation ![]() to denote the poll data.
to denote the poll data.
What we want to compute is a conditional probability, namely, the probability
that the actual electorate has vote split ![]() given that the poll result
is
given that the poll result
is ![]() . The notation for that conditional probability is
. The notation for that conditional probability is
![]() . We use what's known as Bayes Theorem to
compute the conditional probability. Essentially, Bayes Theorem determines a
value for the conditional probability by inverting the question that the
conditional probability expresses. Bayes Theorem says, consider how likely
the poll data are to have occurred if the electorate has vote split
. We use what's known as Bayes Theorem to
compute the conditional probability. Essentially, Bayes Theorem determines a
value for the conditional probability by inverting the question that the
conditional probability expresses. Bayes Theorem says, consider how likely
the poll data are to have occurred if the electorate has vote split ![]() ,
compared to how likely the poll data are to have occurred in all possible
electorates. Bayes Theorem uses the conditional probabilities of the
poll data, given each possible electorate, to compute the conditional
probability that the actual electorate has vote split
,
compared to how likely the poll data are to have occurred in all possible
electorates. Bayes Theorem uses the conditional probabilities of the
poll data, given each possible electorate, to compute the conditional
probability that the actual electorate has vote split ![]() , given the
poll data. My simplified model of how the poll data are created implies that
the conditional probability of a result
, given the
poll data. My simplified model of how the poll data are created implies that
the conditional probability of a result ![]() , given vote split
, given vote split ![]() ,
is
,
is
![]()
Bayes Theorem says
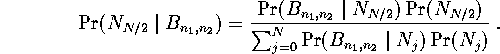
Substituting in the formulas for the various probabilities on the righthand side and simplifying gives
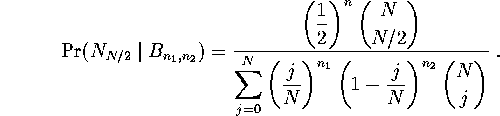
Notice that if there are no poll data, the conditional estimate reduces to the
purely combinatorial estimate. If there are no poll data, then ![]() .
In that case we have
.
In that case we have
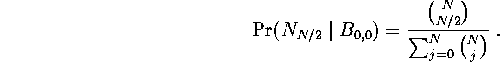
But ![]() .
.
Table 1 shows the probability that one's vote is decisive, for several electorate sizes and poll results.
| Vote Division in Poll Data (Candidate 1/Candidate 2) | |||||
| N | n | .5/.5 | .51/.49 | .55/.45 | .6/.4 |
| 10 | 0 | .2461 | .2461 | .2461 | .2461 |
| 100 | 0 | .0796 | .0796 | .0796 | .0796 |
| 20 | .0873 | .0872 | .0858 | .0816 | |
| 1,000 | 0 | .0252 | .0252 | .0252 | .0252 |
| 20 | .0255 | .0255 | .0254 | .0253 | |
| 100 | .0265 | .0264 | .0253 | .0221 | |
| 200 | .0276 | .0275 | .0234 | .0142 | |
| 500 | .0309 | .0299 | .0134 | .0011 | |
| 10,000 | 0 | .00798 | .00798 | .00798 | .00798 |
| 20 | .00799 | .00799 | .00799 | .00798 | |
| 100 | .00802 | .00802 | .00798 | .00786 | |
| 200 | .00806 | .00805 | .00790 | .00745 | |
| 500 | .00818 | .00814 | .00726 | .00508 | |
| 1000 | .00837 | .00822 | .00531 | .00136 | |
| 100,000 | 0 | .002523 | .002523 | .002523 | .002523 |
| 20 | .002523 | .002523 | .002523 | .002523 | |
| 100 | .002524 | .002524 | .002523 | .002519 | |
| 200 | .002526 | .002525 | .002521 | .002506 | |
| 500 | .002529 | .002528 | .002498 | .002407 | |
| 1000 | .002536 | .002531 | .002413 | .002080 | |
| 1,000,000 | 0 | .00079788 | .00079788 | .00079788 | .00079788 |
| 20 | .00079789 | .00079789 | .00079789 | .00079789 | |
| 100 | .00079792 | .00079792 | .00079788 | .00079776 | |
| 200 | .00079796 | .00079796 | .00079780 | .00079733 | |
| 500 | .00079808 | .00079804 | .00079709 | .00079411 | |
| 1000 | .00079828 | .00079812 | .00079431 | .00078249 | |
| 10,000,000 | 0 | .00025 | .00025 | .00025 | .00025 |
| 100,000,000 | 0 | .0000798 | .0000798 | .0000798 | .0000798 |