A while ago I promised to talk about some of the problems opticians encounter while using interferometers. Interferometers are used to test all kinds of optics, including telescope mirrors. You probably know that when two waves of light encounter one another, they interfere with each other in a complex way to produce a new wave, very much like what happens to waves in the bathtub.
In an interferometer, one of the waves comes from a “reference” surface, ideally a plane or sphere, and the other from the optic under test. The new wave is the difference between the two, and if the reference wave is considered to be “perfect,” then subtracting it from the test optic’s wave produces a new wave that can be considered to be just the errors of the test optic.
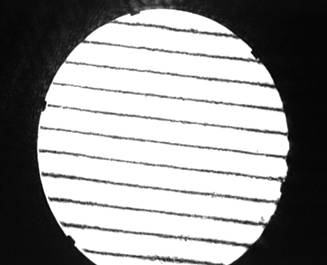
Figure 1
This test is surprisingly powerful and easy to interpret. If the two waves have the same wavelength, and they usually do, because they are usually split from the same laser source, then the resultant wave’s “interference pattern” can be interpreted as a kind of topological map of the test optic, with the light and dark fringes representing constant steps in height. If the two wavefronts are planar, and are tilted with respect to each other, then, when they interfere, their difference is a wedge. Constant steps in height along a wedge are represented by a series of straight lines. Figure 1 shows 6” of an 8” diameter fused silica reference flat made by Karl Mueller, interfering against another of his flats. The lines are straight. They’re both pretty good flats.
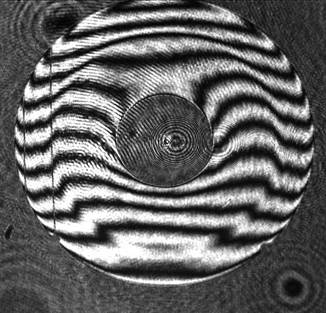
Figure 2
If one of the surfaces has a bump on it, then the straight lines will begin to resemble the National Geological Survey’s maps of West Virginia. The beauty of these lines is that they represent measurable departures from a reference surface; usually each dark fringe is a step of half a wavelength of the laser light. There is no guessing about how far off from the reference wavefront the test optic is. You just stretch a line across the interference pattern and compare the straightness of the line to the fringes. If you tilt the test optic correctly, then a turned down edge shows itself as a fringe that turns down near the edge of the mirror. How much does the edge turn down? Just compare the amount to the half wave fringe spacing. Figure 2 shows a 14” f/2 Cervit mirror that is just starting its long departure from a sphere. The edge is turned up by a quarter wave, it has some rough zones just in from there (potentially very bad because of their high frequency), and the center slopes down to the cut out core. What else do you need to know?
Now you have a tool that tells you not only what, but how much, correction you need to make in your next polishing session. You also can more easily figure out when to stop, and that is one of the differences between good and great opticians.
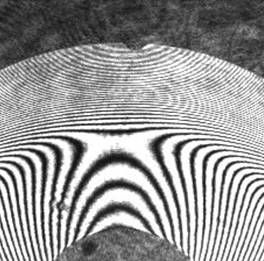
Figure 3
Of course, good results depend on the accuracy of the reference wavefront, and here, many things can go wrong. If the reference wave has a bump in the middle, then figuring the optic to perfectly straight lines will put a hole in it. This kind of thing can be avoided by testing a portion of a larger optic, and then “sliding” it sideways across the reference wavefront. If the bump stays put, then it’s on the reference surface. Even if you have a very good flat or sphere to produce your reference wave, you may be making something that departs radically from that. Figure 3 shows the same 14” f/2 Cervit mirror, now well on its way to the 119 fringes of correction it needs. It’s pretty hard to tell if those fringes are where they should be, to a tenth wave, just by looking at them.
For better accuracy, fringe analysis software is usually employed. It can remove errors produced by bad alignment and poor focus of the interferometer optics, can compensate for deep aspherics, and can give you a report on the “accuracy” of the wavefront, but it should be investigated carefully. Karl used fringe analysis software to evaluate his test flats, and it reported that the flats had an RMS error of about 1/100 wave, with a left edge turned up 1/14 wave, and the right edge turned down by the same amount. Karl, puzzled because he knew his flats were better than that, then evaluated a much smaller section of his flat, and the report was the same across the smaller area. The errors that the program reported were intrinsic to the program, residuals from the math.
Many opticians prefer to reduce the large fringe differences between a spherical reference and an aspheric optic by shaping the reference wavefront to become aspheric. This is done by auxiliary optics and is known as null testing. This kind of testing is not without peril; the Hubble telescope was (mis)made by incorrectly shaping the reference wave, then making the mirror to match it.
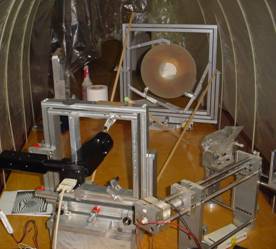
Figure 4
There are also problems meeting the mechanical requirements for sturdy, smoothly adjustable optical mounts that are stable to small fractions of the wavelength of light. There is a need to limit air currents, which can contribute significantly to fringe position error. Figure 4 shows some of the testing equipment used in interferometry. But even with all of these problems, interferometry is still much easier to use, and gives more believable results, than anything else.