|
Education
[...Overview...]
[...Community Action...]
[...Interesting Facts...]
Student Body Composition
|
Staff Composition |
54.3 % Hispanic
29.9% Black
9.4% White
4.4% Multi-ethnic
1.1% Asian/Pacific Islander
.9% American Indian
|
40.8% Hispanic
33.2% White
20.3%
Black
4.9%
Multi-ethnic
.5%
Asian/Pacific Islander
.3%
American
Indean
|
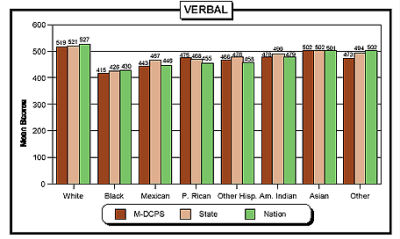
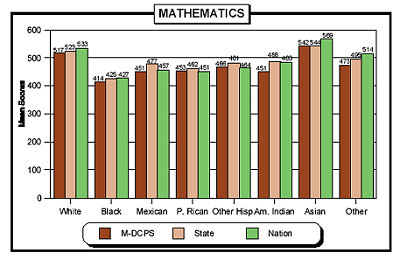
These two graphs show district, state, and national SAT 1 results by
Race/Ethnicity. The Dark red represents Miami-Dade Public County
Schools, Pink represents the State of Florida, and Green represents the
national average. As we can see, Miami-Dade schools lag
behind those in the rest of the state and the country in both the
Verbal and Math SAT 1 for virtually every ethnic group.
|
Site
created by Kim Brow, Carmen Lafia, and Umang
Malhotra 2004
|