The Final Corner: H-NMR Correlation for Molecule 10
Welcome to the end of the test track. Roll over either the peak, chart, or hydrogen on the molecule to view the spectroscopic assignments. Keep note that the three large peaks are labeled as impurities and are not part of this molecule.
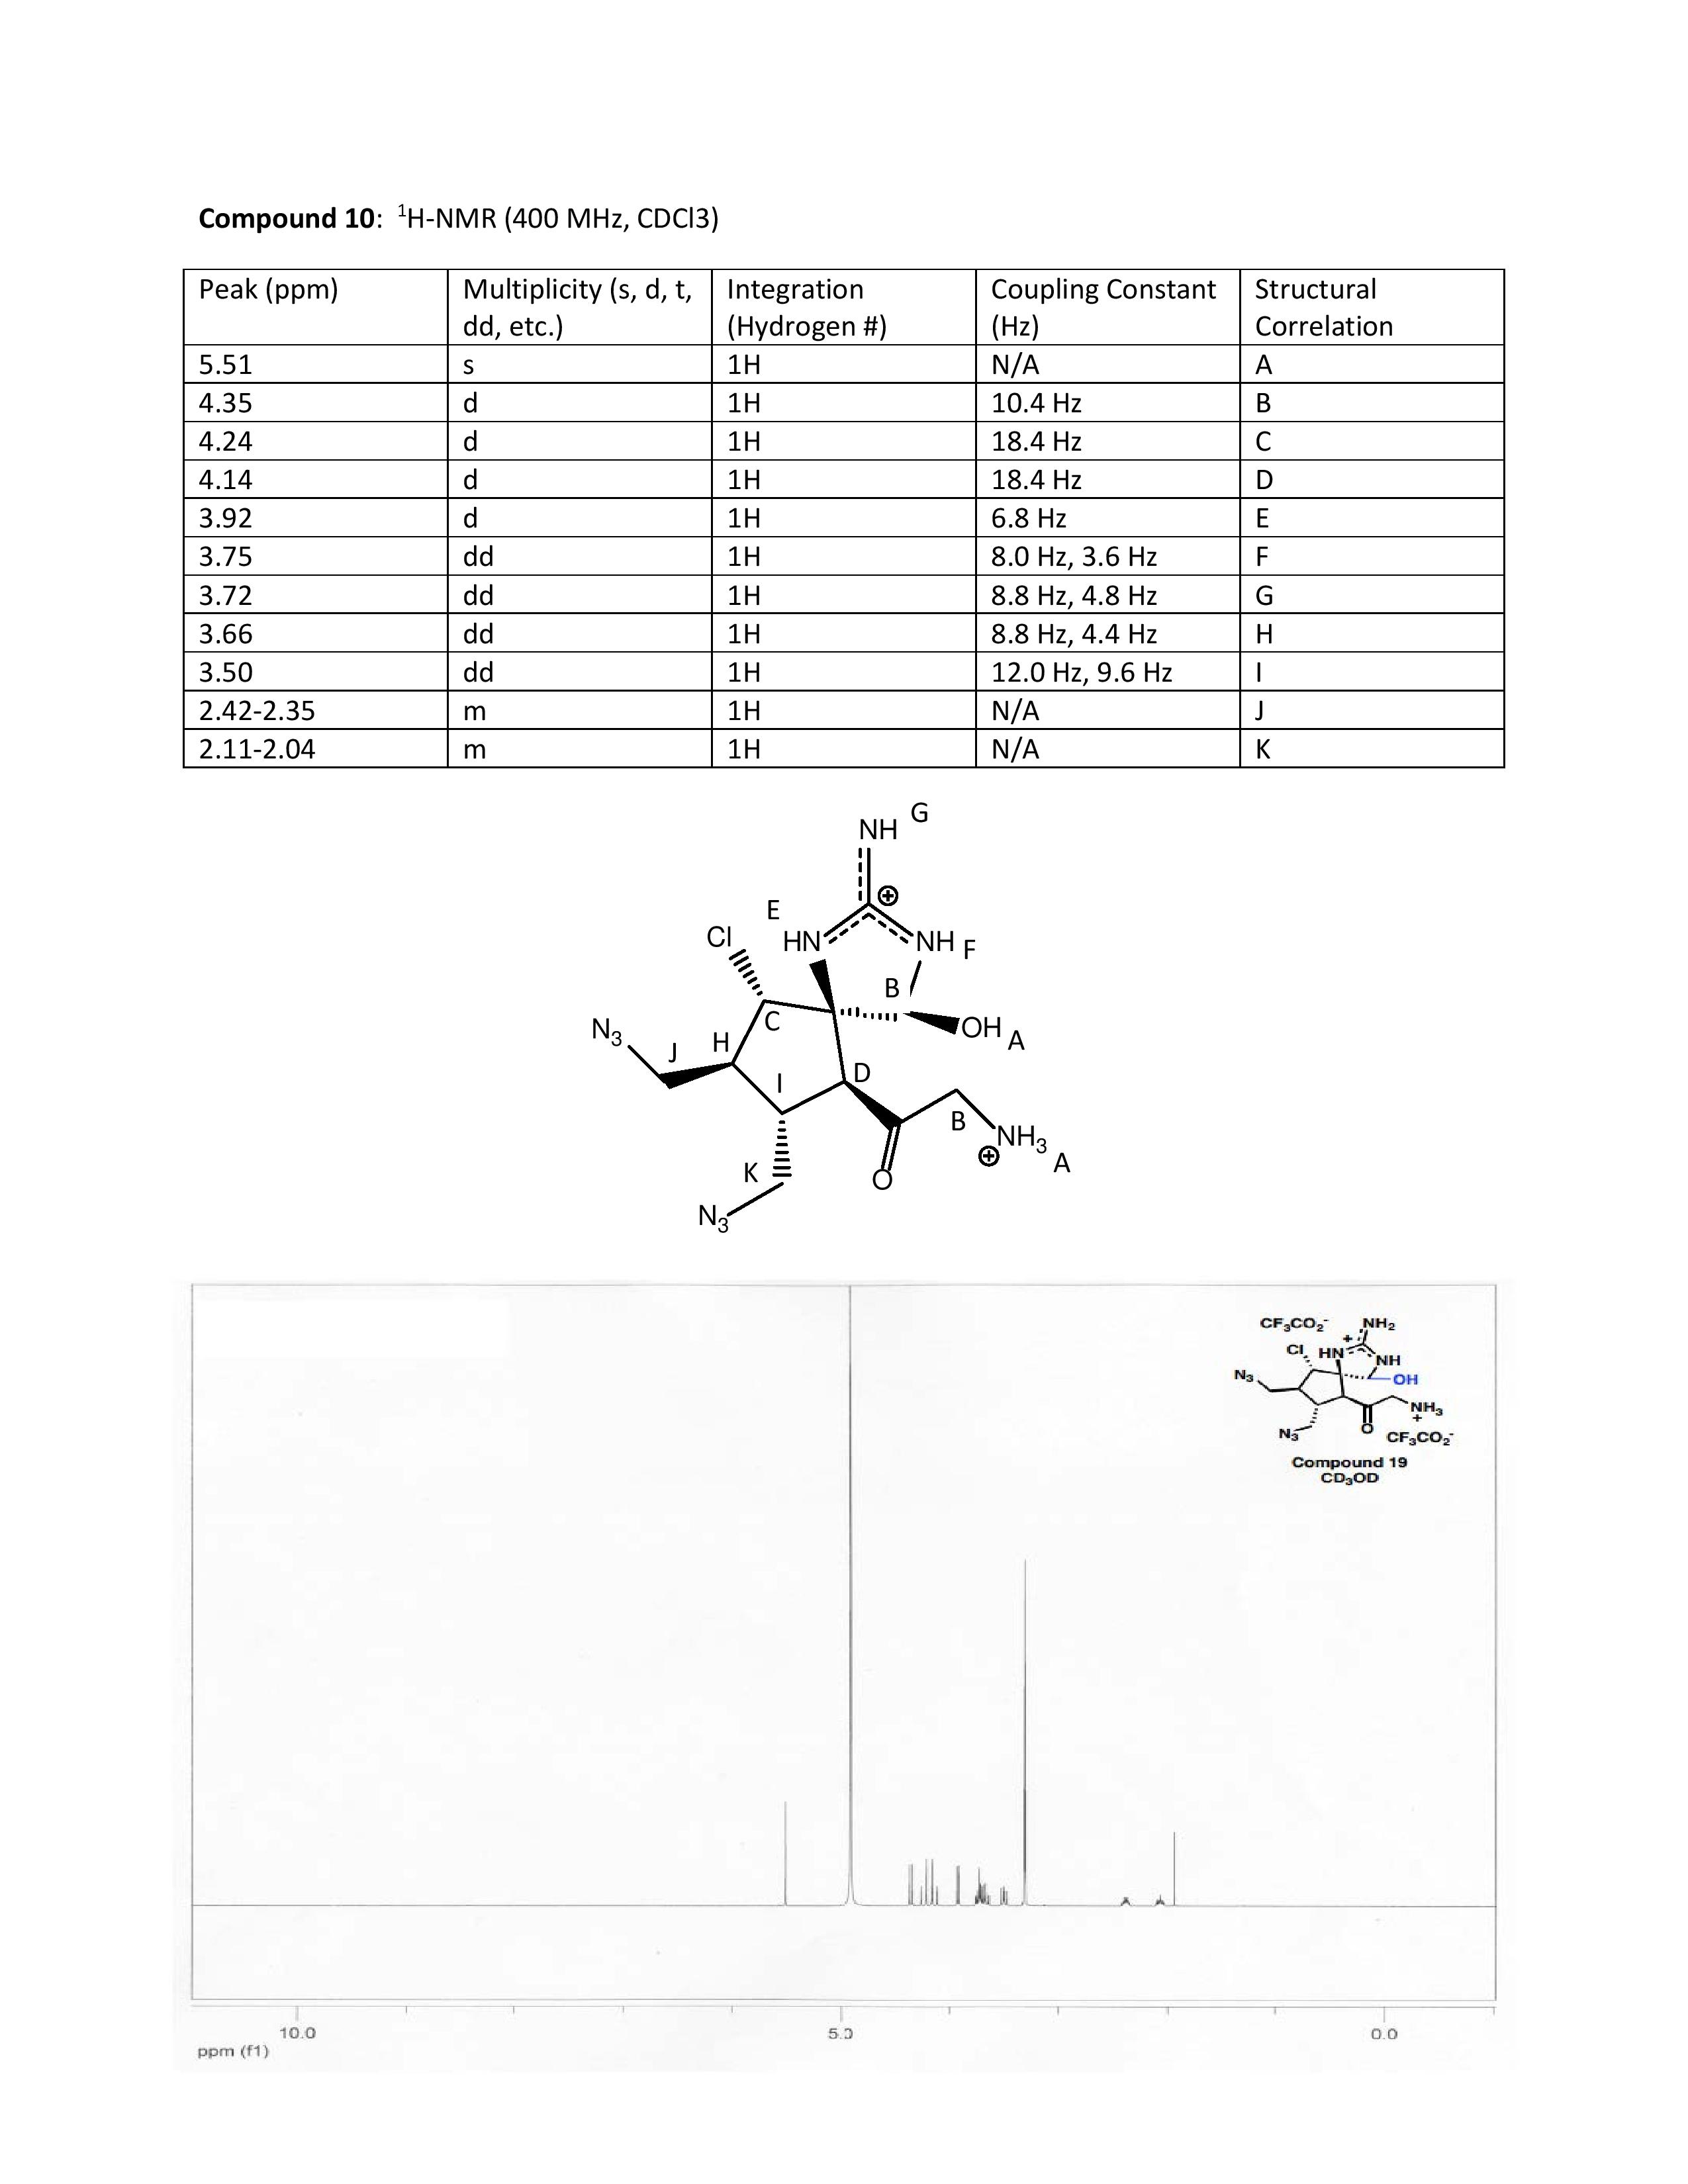
The following peaks were assigned due to the chemical shifts. The H-NMR data given in the literature reported all 1H peaks due to integration.
Peak A was assigned to the OH and NH peaks as it was the highest chemical shift. The presence of the oxygen and nitrogen atoms makes the hydrogen more deshielded. In actuality, we would expect the NH to be further downshielded as the 5.0 ppm range is usually characteristic of OH
Peak B was assigned to the beta hydrogen to the oxygen. The proximity to both an oxygen and a nitrogen makes it quite deshielded. It could couple with any close hydrogens that are not true three bond neighbors.
Peak C was assigned to the hydrogen on the carbon adjacent to the chlorine. The halide makes the hydrogen deshielded and the hydrogen can couple with the adjacent beta hydrogen.
Peak D was assigned to the hydrogen adjacent to the carbonyl. The similar coupling constant of 18.4 with C may be due to them being on the same ring.
Peak E was assigned to the hydrogen on the one nitrogen in the ring. This was due to the proximity to the nitrogen atom.
Peak F was assigned to the hydrogen on the other nitrogen in the ring. This was due to the proximity to the nitrogen atom and the chemical shift at 3.75 ppm.
Peak G was assigned to the nitrogen at the very top. due to the chemical shifts at 3.72 ppm. The J constants do not seem to correlate here, though we felt that because the chemical shifts were more reasonable at a more deshielded location.
Peak H was assigned to the hydrogen on the lower ring as it had the appropriate chemical shifts at around 3.66 ppm.
Peak I was predicted to be on an adjacent carbonn to the hydrogen at H. Although the J constants were slightly different, the chemical shifts were similar.
Peaks J and K were assigned to the multiplets in the 2.0 ppm.
The NMR data was mainly interpreted due to the chemical shifts at the peaks. When the coupling constants were used to assign hydrogens that could potentially couple with each other, the resulting chemical shifts did not make sense. As a result, we interpreted the data mainly through chemical shifts.
|The Track| |About Us| |Transition Metal Oxidations| |Procedure| |The Previous Step| |References|
![]()